Cardano’s price analysis shows an upward trend for cryptocurrencies today. The bulls have been able to raise the price to $0.3686 in the past 24 hours. It appears that after dominating the market for the past week, the bulls have now overtaken the bears. But this could be short-lived, as the pressure on the market is still high and could lead to a downturn in prices at any moment. The support for the ADA/USD pair is seen at $0.3598, and if broken, we could see a dip to the $0.36 level. ADA/USD is now trading above the $0.3686 mark after increasing by more than 0.53% over the last 24 hours with a market capitalization of $12.5 billion, and trading volume is currently at $243 million.
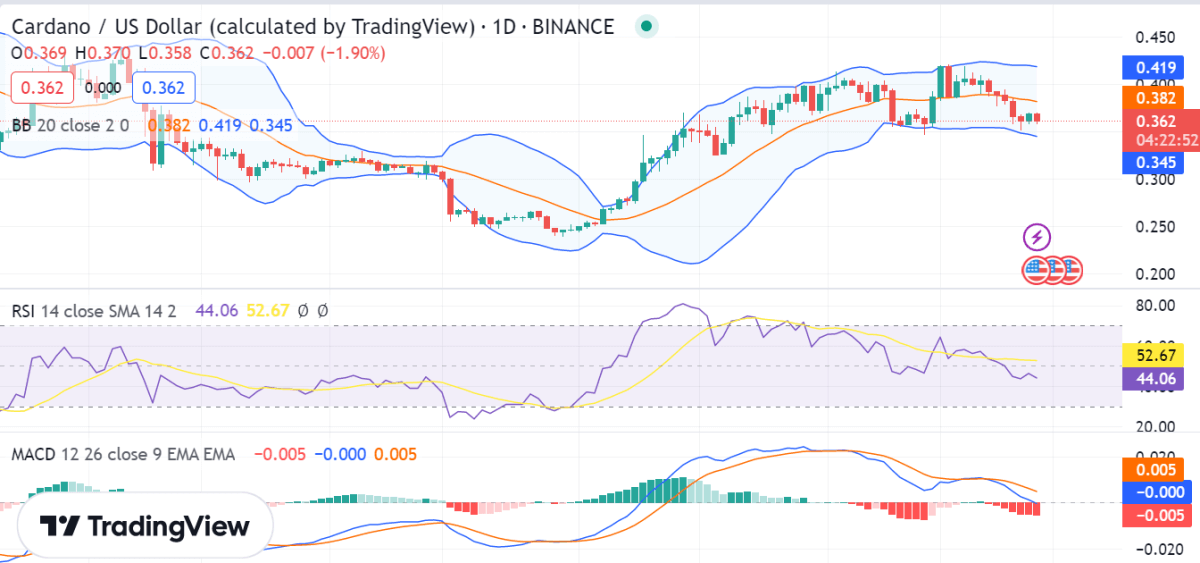
Cardano price analysis 1-day chart
The 1-day Cardano price analysis indicates that the bulls are dominating the market and have pushed prices higher. If the buyers continue to hold onto their positions, then we could see a sustained uptrend from here onwards. In addition, volume is increasing, which signals that the momentum is strong and could lead to further price increases. The next resistance level is at $0.3686 and, if broken, could lift the ADA/USD pair to new highs.

The technical indicators are currently bullish, as the moving average convergence and divergence (MACD) is above zero and the relative strength index (RSI) is well above 50, which indicates that the market is neither overbought nor oversold. The Bollinger Bands remain in an uptrend, and there have been some recent higher highs on the shorter timeframes. The upper Bollinger band is now at the $0.419 level, and the lower Bollinger band is at $0.345. This suggests that buyers still have some momentum, which could push prices higher in the near future.
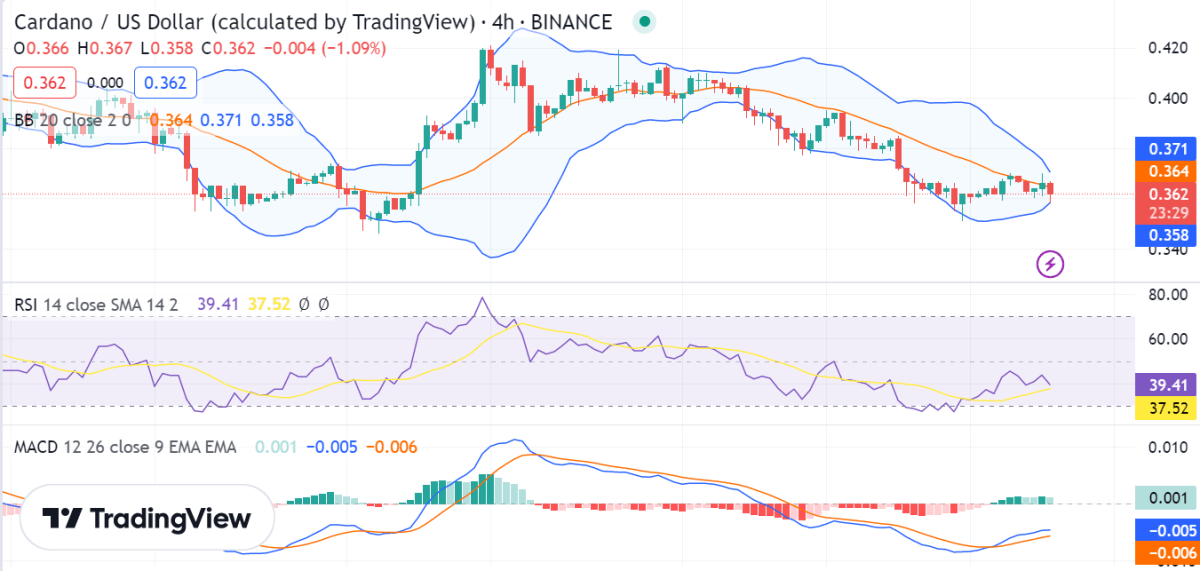
ADA/USD 4-hour price chart: Latest development
Looking at the hourly Cardano price analysis, the ADA price has been on an upward trend, and buyers are still in control of the market, which could lead to further gains in the coming days. The momentum is still positive, and it appears that the bulls could remain in control of the market for some time yet. With this being said, traders should be aware that any sharp pullbacks could lead to a sudden drop in prices, so they should trade with caution.

The market’s volatility is currently high and could cause some ups and downs in the short term. The Bollinger band’s upper value is 0.374, representing the resistance for ADA, whereas the lower value is $0.358, representing the strongest support for the ADA price. The RSI is currently at 37.52, which indicates that the market is overbought. The MACD is above the signal line, and the histogram is in the positive zone. This indicates that buyers have the upper hand, which could lead to a further increase in prices in the near future.
Cardano price analysis conclusion
In conclusion, the ADA/USD pair appears to be bullish in the short term and could continue to push up prices. However, given the volatile nature of cryptocurrencies, traders should monitor the market closely and always trade with caution. It’s important to remember that the market could experience sharp pullbacks at any time, so it is always better to practice risk management techniques when trading digital assets.


