Cardano price analysis for today shows ADA/USD losing 2.85 percent and trading at $0.3509. The bears have attacked the market, dragging the price lower after it could not break past resistance at $0.3825. The bears have been dominating as the price has again decreased to a low of $0.3509. The bearish trend had cast quite negative effects on the cryptocurrency’s value as the larger trend has been bearish for a long time.
Today’s start of the trading section, the bulls were dominating the price as the price increased to $0.3825, but the bullish momentum was not able to sustain, and the bears took control over the market. The selling pressure has been increasing as the price has decreased to $0.350 level, which is acting as a support level for the ADA/USD pair. The bulls might face a tough time in the market as the bears are still dominating. Traders should be cautious and not enter into any trades without proper market analysis.
ADA/USD daily chart analysis: Bears gather strength to push prices lower
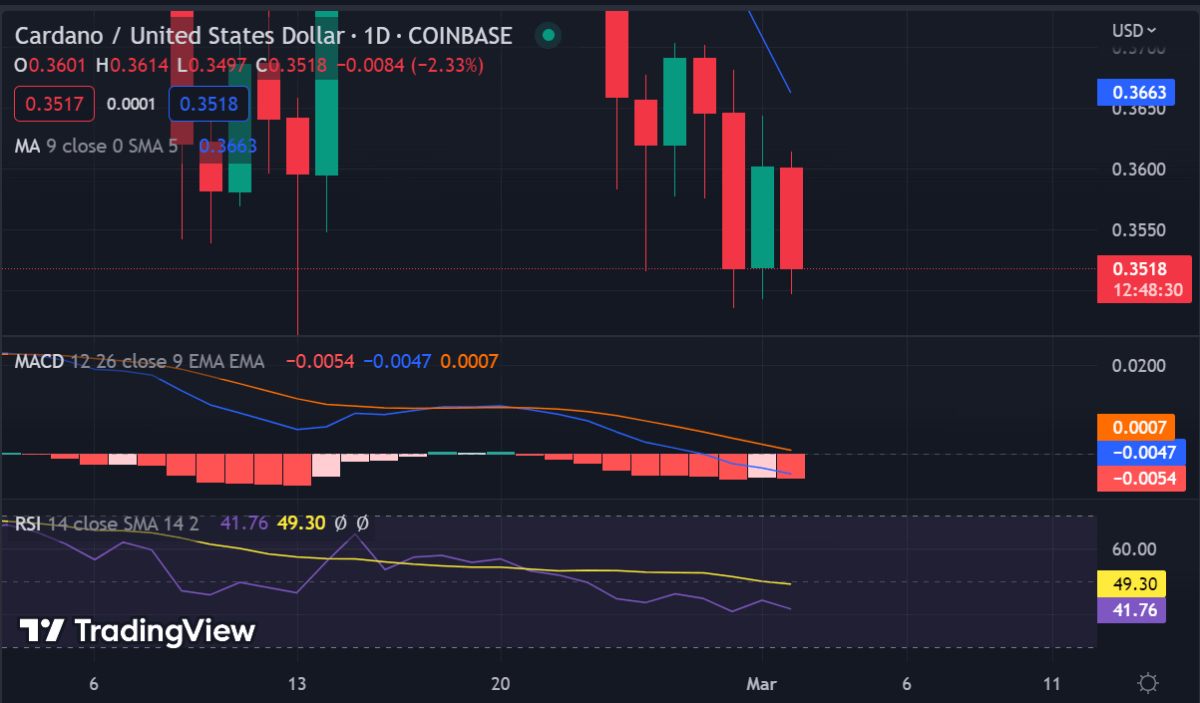
Cardano price analysis on the daily timeframe indicates the bears have had the upper hand for most of the time. The price has been decreasing since the start of the week when it tested resistance at $0.3825 and could not break past this level. The bears have been dominating as the price decreased to a low of $0.3390 before finding support at the $0.3509 level.

The relative strength index (RSI) is currently seen at 34.17, indicating the presence of bearish momentum in the market. The moving average convergence divergence (MACD) is also seen decreasing and has been below the 0 levels for a while now. This indicates that selling pressure is strong and could push prices lower unless there is a sudden surge in buying pressure.
Cardano price analysis on a 4-hour chart: Bearish divergence pattern is forming
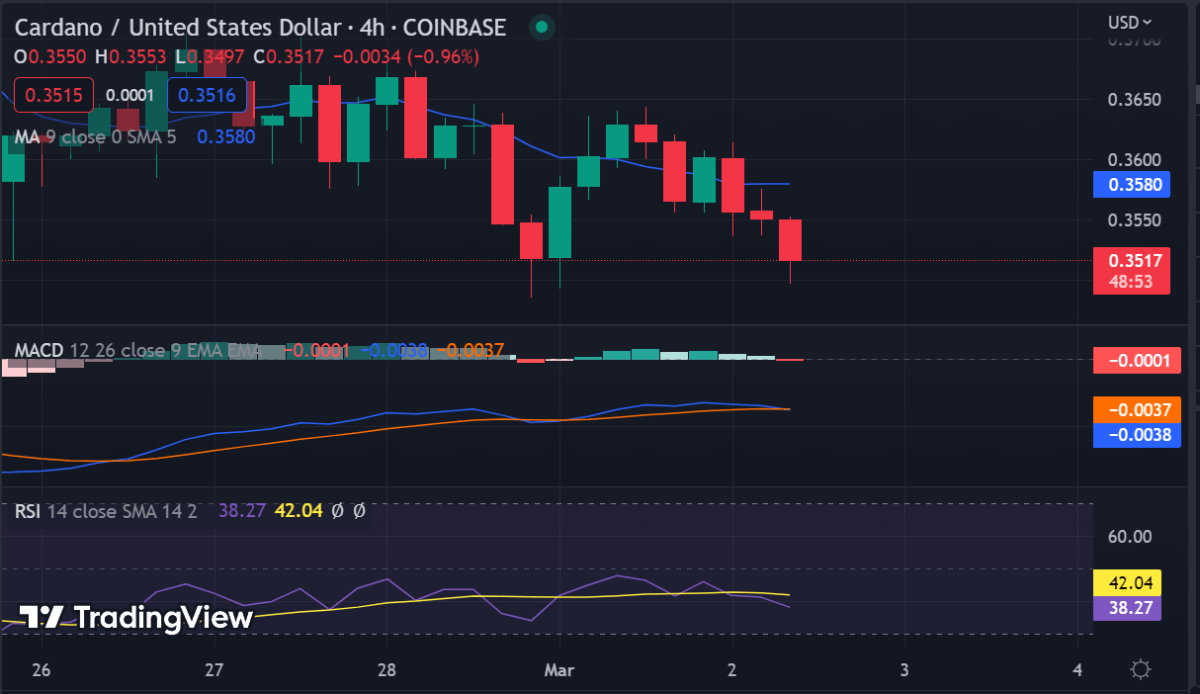
Cardano price analysis on the 4-hour chart shows a bearish divergence pattern forming. This could indicate further selling pressure in the market, and traders should be cautious of entering any trades. The resistance for ADA/USD is present at $0.3637, while support is seen at the $0.3509 level. The Fibonacci retracement levels also show a bearish trend as the 61.8 percent level is seen at $0.3525, and this could act as a strong support if the price drops to that level.

The price of Cardano is trading below the daily MA of 10 and 20, which is a bearish sign. In addition, the RSI has been consistently below 40 levels for some time now, indicating that the bears have been in control of the market.
Cardano price analysis conclusion
Today’s Cardano price analysis indicates that the bears are dominating the ADA/USD pair. The price has retraced to $0.3509 after failing to break above the $0.3825 resistance level, and bearish momentum is increasing in the market. The 4-hour chart shows a bearish divergence pattern forming, indicating further downside potential for ADA/USD.


