Dogecoin price analysis for today shows that the DOGE/USD pair has fallen to $0.06491 after a strong bearish signal. The downtrend was confirmed with a break below the support at $0.06434 and a failure to hold on to the ascending trend line. The bears took control, and the pair is now trading at a low of $0.06491. The key resistance levels are seen at $0.0682, and any move above this level could push the price toward a high of $0.065. The 24-hour trading volume for the DOGE/USD pair has spiked to a high of $450 million and is currently hovering around $451 million, while the market capitalization for the coin currently stands at $8.61 billion.
Dogecoin price analysis 1-day chart
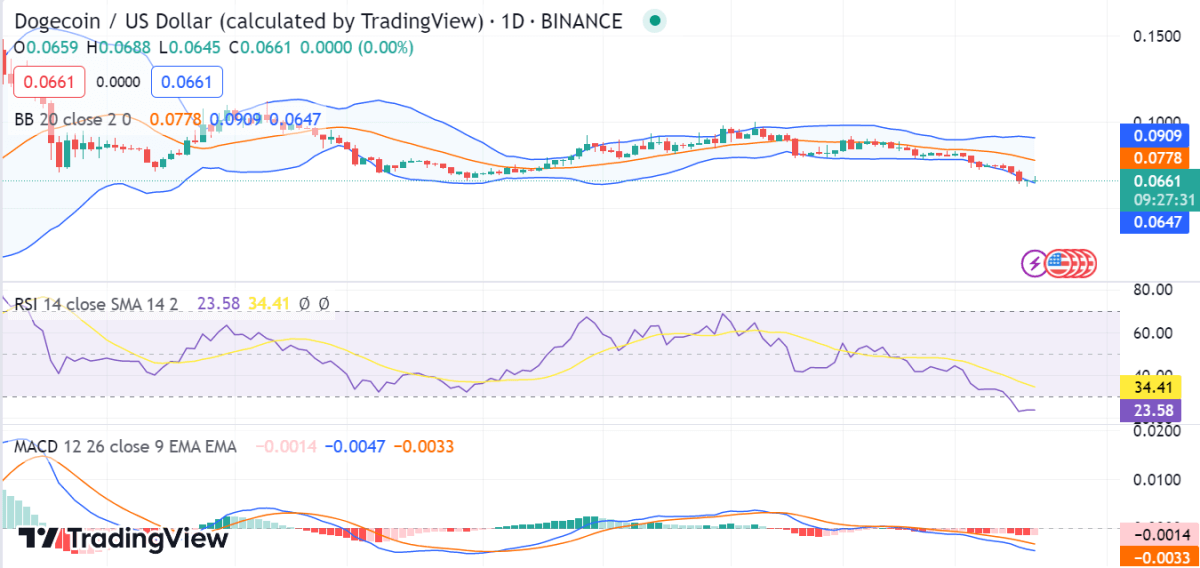
The 1-day Dogecoin price analysis shows that the coin is still in a bearish trend and has formed lower highs since yesterday, which could have been caused by a lack of buying pressure. The technical indicators also suggest that the bears are likely to continue dominating the market in the near term. The upper limit of the Bollinger Bands Indicator is standing at $0.0909, whereas the lower limit is standing at $0.0647.

The moving average convergence and divergence (MACD) indicator is bearish, with both moving averages stacked beneath each other and well below the zero line. This indicates that we could possibly see more bearish movement in the near future. The relative strength index (RSI) is equally bearish, hovering around 34.41, implying that there is still room for the bears to take control of the market.
DOGE/USD 4-hour price chart: Bearish momentum continues
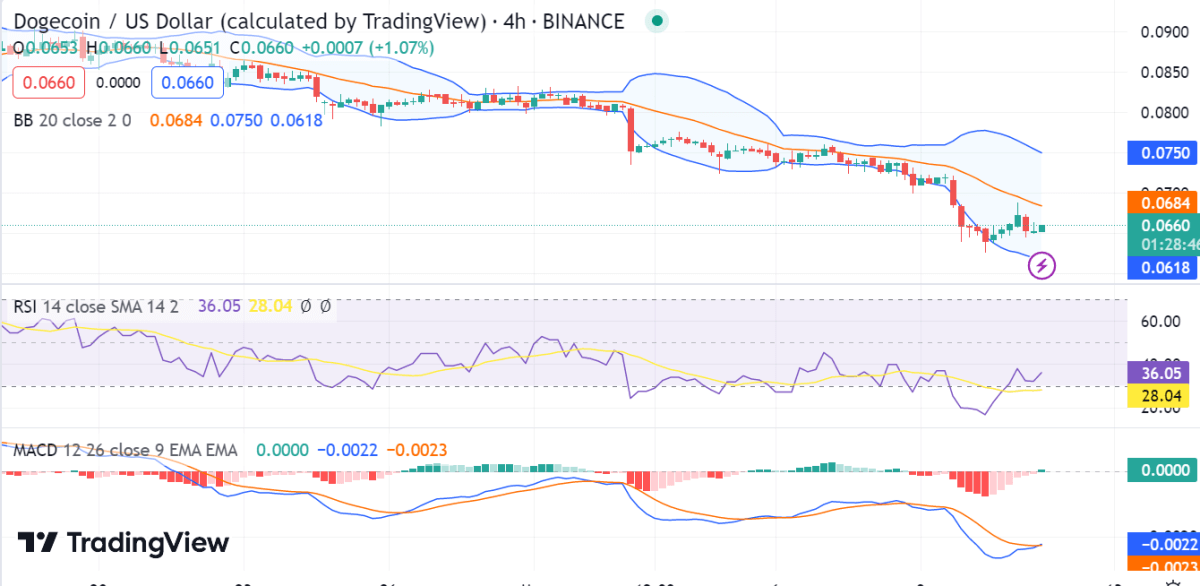
The hourly Dogecoin price analysis also shows that the market for the DOGE/USD pair is falling as selling pressure grows. The price has dropped from a high of $0.06521 to the current level of $0.06491 after breaking below the support at $0.08419. The market’s volatility is relatively low, and the price has been consolidating within a tight range. The Bollinger band’s upper band, or $0.0750, represents the DOGE price’s greatest resistance. Bollinger’s band’s lower boundary, which represents DOGE’s strongest support, is at $0.0618.

The technical analysis also indicates that the price is likely to remain in bearish territory for the foreseeable future. Additionally, the relative strength index (RSI) has dropped below 28.04, which is another confirmation of bearish market sentiment. The moving average convergence and divergence (MACD) has crossed over with the signal line in the negative zone, which is indicative of bearish momentum.
Dogecoin price analysis conclusion
Overall, it appears that Dogecoin is still in a bearish trend, with no sign of a strong recovery yet. The technical indicators suggest that the bears are likely to remain in control of the market over the near term. The most recent negative trend caused the price levels to drop to a low of $0.06491. Bulls may try to change the course of events and drive the price back up, though. Therefore, traders should be cautious and not enter any trades without doing a thorough market analysis.


