The Cardano price analysis shows a bullish trend in the cryptocurrency as it has moved above the $0.3044 mark after a brief dip. The digital asset is now recovering and is up 3.60 % over the past 24 hours. The ADA/USD is currently trading at $0.3194 as bulls are expected to continue the uptrend.
The current market sentiment for Cardano is bullish as traders focus on buying ADA at lower levels and holding it for long-term gains. If the bulls can continue to push the price higher, we could see ADA prices reach the previous month’s all-time highs of $0.33 levels or even higher in the near future. A strong support level is present at the $0.3044 mark. If the bulls can keep prices above this level, we could see another leg up in the uptrend.
ADA/USD 1-day price chart: Bullish momentum returns after a break
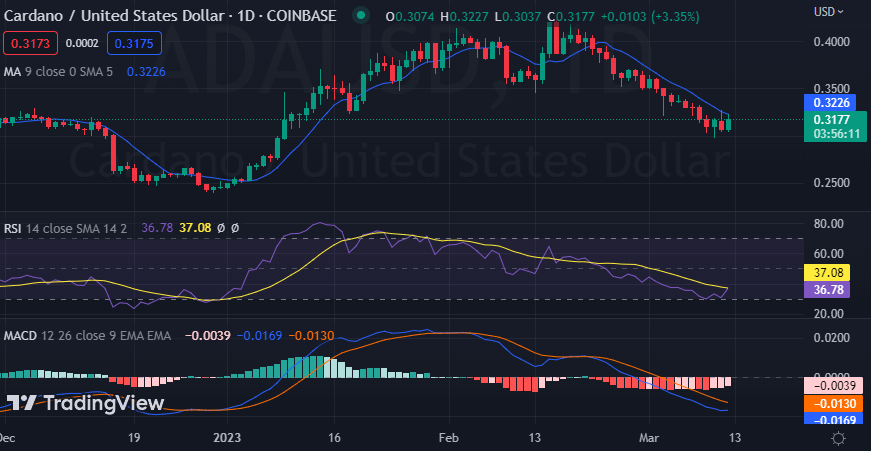
The 1-day Cardano price analysis reveals that the market for ADA/USD is in an uptrend after a strong buying pressure pushed the price above $0.30. The month started with a strong bearish trend, but the bulls have since taken control of the market and are now pushing the prices higher.
Further advancement is to be expected as the bullish momentum is strengthening with each passing day. The moving average (MA) indicator is also moving upwards, which is a positive sign, and is settled at the $0.3226 position for the day.

The Relative Strength Index (RSI) has also improved according to the situation as well and has moved up towards index 40 and is expected to further advance. The MACD trend line has also seen a positive crossover and moving toward the signal line, confirming that the buying pressure is strong.
Cardano price analysis: Recent developments and further technical indications
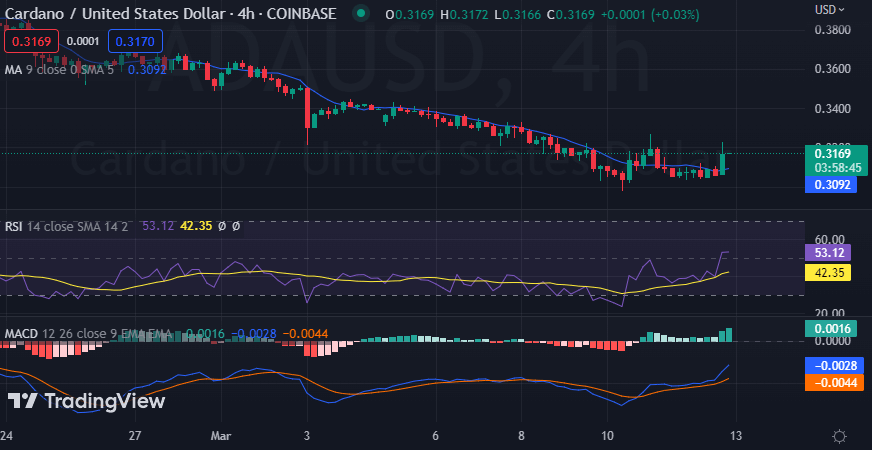
The 4-hour Cardano price analysis is following the bullish trend as the price has increased again during the last four hours. The price levels are going up after dodging past a bearish feat that took place in the past few days. Currently, the price is settled at the $0.3194 mark and is expected to go a bit up from here toward a higher position.

The moving average is trading at $0.3092 because of the constant price fluctuations. The 100-MA and 200-MA are at $0.3169 and $0.3170, respectively. The RSI is above the 50-position, which shows that the buying pressure is increasing. The MACD indicator has confirmed a positive trend, with the MACD line crossing above the signal line.
Cardano price analysis conclusion
The Cardano price analysis suggests the price is going high today as it has been able to reach the $0.3194 level during the last 24 hours. The price has improved significantly if we compare it with the last week’s statistics. There are further chances of recovery for the bulls as the support is quite strong, and traders can expect ADA/USD to continue upside for the next 24 hours.


