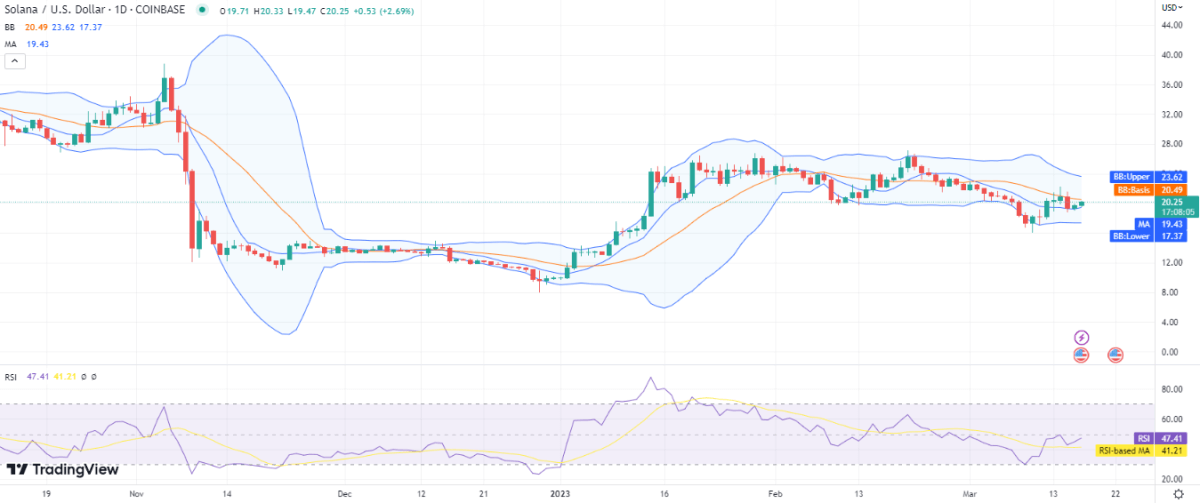
The coin’s price has significantly increased over the past 24 hours, and the most recent Solana price analysis indicates a bullish tendency. The price has increased considerably as a consequence of the bullish upswing and is now at the $20.25 level. Even though the price fell on March 15, 2023, support showed up the following day, and a rebound was started. Since the bulls have now taken control, the trend today supports buyers. The price function could also overcome the $20.90 barrier in the ensuing hours.
SOL/USD 1-day price chart: Price recovers to $20.25 as an upward pattern continues
The price of Solana is increasing, according to the 1-day price chart for Solana price analysis, and there have been no bearish periods so far today. SOL reports an increase of more than 20% in value over the past week despite the significant correction seen on March 15, 2023, and the SOL/USD price has risen to $20.25 at the time of writing, earning a value of 4.17 percent over the last 24 hours. Despite a 42 percent decline in trading activity, the market cap has grown by 4.03 percent, giving it a 0.69 percent market share.

The SMA 20 curve is moving below the SMA 50 curve, indicating that there may be bearish pressure in the market. However, if the bullish momentum persists, the SMA 20 will pass above the SMA 50 in the following trading session. The Bollinger bands indicator is also displaying a change in values; currently, the upper band is at $23.62 and represents SOL’s resistance, while the lower band is at $17.37 and represents the currency pair’s greatest support. Finally, today’s bullish advance increased the Relative Strength Index (RSI) number to index 47.
Solana price analysis: Recent developments and further technical indications
The four-hour Solana price analysis predicts a significant price rise because the bulls have been in the lead. Additionally, an increase in coin value has been noted over the past four hours, with the price rising to $20.25. For the past 36 hours, the price has been rising steadily, and it is anticipated to keep rising throughout the day. The moving average for the 4-hour price indicator is still at a significantly lower level, or $19.72.

The comparatively high level of volatility suggests that the price fluctuations will also be high in the ensuing hours. Additionally, as a consequence of this, the upper Bollinger band has reached $21.71, and the lower Bollinger band has reached $18.67. As a result of the consistent purchasing activity over the previous eight hours, the RSI score has increased to index 54, and the RSI curve is currently moving upward.
Solana price analysis: Conclusion
According to the Solana price analysis, the market has been experiencing bullish momentum, which has caused prices to move upward over the past 24 hours. For the majority of the previous week, the price has been moving in a bullish direction. Currently, the price is heading toward the $20.90 resistance point. Given that both the hourly and daily forecasts are going in favor, the bullish rally may intensify in the hours to come. However, as the price approaches the $21 level, a correction could also occur. We anticipate SOL to rise further today as bulls look for a $20.90 target as their next target.


