The Chainlink price analysis shows that the momentum for LINK/USD is bullish. After finding support at $7.17, the price started to rise once more. Previously, the cryptocurrency corrected yesterday after a sharp decline in price levels. The cryptocurrency has gained a substantial amount of value thanks to the bullish momentum, and the price is currently recovering. Support for LINK/USD is firm at $6.76, while opposition for LINK/USD is present at $7.40, the area where LINK encountered rejection yesterday, followed by another resistance at $7.53.
LINK/USD 1-day price chart: LINK increases in worth thanks to bullish sentiment
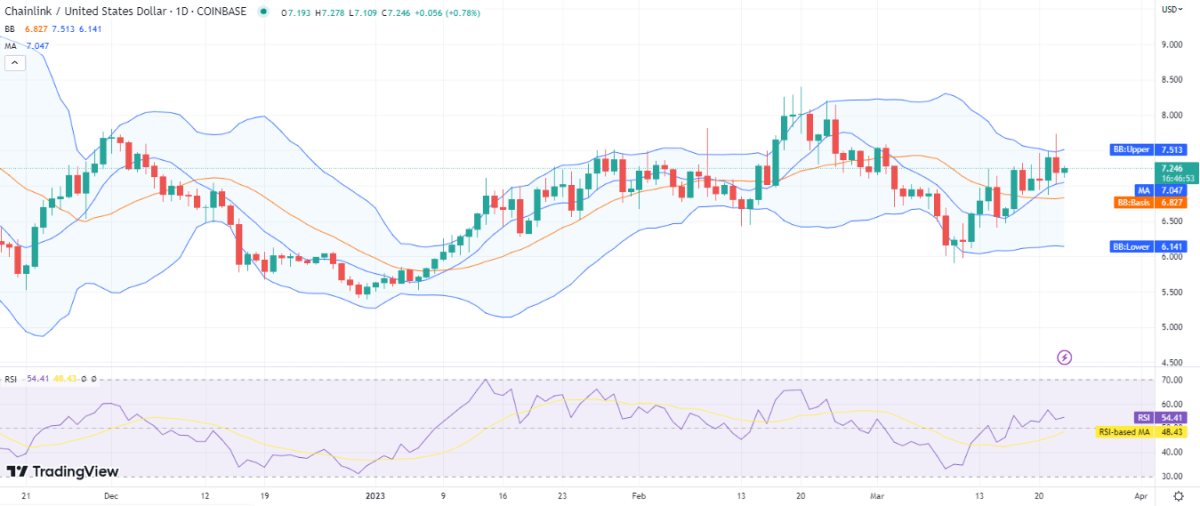
The 1-day price chart for Chainlink price analysis reveals a price rise. The LINK/USD is trading hands at $7.24 at the time of writing. The crypto pair is still at a loss of 3.88 percent if observed over the last 24 hours due to yesterday’s correction but has gained a value of 9.01 percent over the course of the last seven days. The trading volume has increased by 29.60 percent, and the market dominance is 0.32 percent for today.

Given that the Bollinger bands for LINK/USD encompass a larger area, there is a high level of volatility. The 1-day data shows that the price has been moving in a zigzag pattern over the past few days. The lower Bollinger band is present at the $6.14 mark, which represents the lowest level of support for LINK/USD, and the upper Bollinger band is present at the $7.51 mark, which represents a level of resistance for LINK/USD.
At an index of 54 and an upward slope, the relative strength index (RSI) is in the top half of the neutral zone. Today’s buying action is progressing, according to the indicator.
Chainlink price analysis: Recent developments and further technical indications
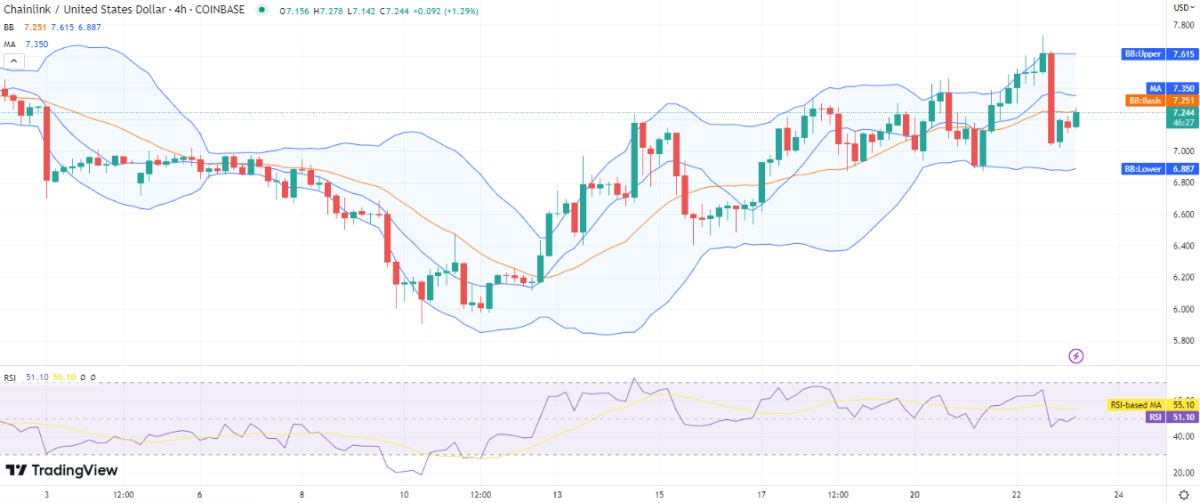
The 4-hour Chainlink Price Analysis reveals that bulls have effectively resisted the bearish assault that began in the final minutes of yesterday’s session, as the price function is once more moving upward after a sudden decline that lasted for a full four hours.

The 4-hour chart’s volatility is also elevated due to the expansion of the Bollinger bands. The average price is $7.25, with the upper range at $7.61 and the lower band at $6.88. Just above the LINK/USD price level is where the average of the Bollinger bands is located. The RSI is in the neutral zone at index 51 and is moving upward, suggesting an increase in market buying activity.
Chainlink price analysis: Conclusion
The Chainlink price analysis predicts further price improvement and a potential continuation of the upward price trend today. The technical indicators indicate that the price of LINK/USD will increase further in the ensuing hours due to the bullish market sentiment toward LINK/USD. Chainlink may challenge the resistance of $7.40 in the present or next trading session.


