The Ethereum price analysis reveals that the bulls are back in control of the market. The uptrend is strong and ETH/USD has broken above the $1,750 level. The cryptocurrency surged higher to the $1,757 level with a 1.45 percent increase in price. The buying pressure is likely to remain steady in the near term as traders eye further gains.
The bullish momentum is strong, with a market capitalization of $218,953,936,932, with an increase of 2.05% over the past 24 hours, and could continue increasing as investors look to capitalize on potential price breakouts. The 24-hour market is still down 2.15% from the last 24 hours and ETH/USD could possibly reach a higher level if the buying pressure continues.
Ethereum price analysis 24-hour chart: Bulls succeed in securing a position above the $1,750 level
The 24-hour Ethereum price analysis reveals that bulls have managed to secure a position above the $1,750 level. The bulls will have to break the resistance level of $1,853 in order to continue their uptrend. If this happens, then ETH/USD could target the next major resistance at $1,900. On the downside, if selling pressure increases then ETH/USD may dip down to retest the previous support of $1,745.

The technical indicators are bullish and suggest that the bulls may have further room to push higher in the near term. The RSI is above 50 levels which indicates that a neutral market condition is about to be triggered. However, the MACD has just crossed above the signal line in favor of the bulls and suggests further upside. The moving average indicator is currently at $1,766, suggesting the bulls are in control of the market trend.
Ethereum price analysis: Recent developments and further technical indications
The 4-hour price chart for Ethereum price analysis further reveals that the bulls are to take control of the market today, In the past 4 hours, the price of ETH/USD has risen to $1,757 from an opening price of $1,750. This indicates that the bulls are making moves in order for the cryptocurrency to make further gains, However, selling pressure could come into play if the price fails to break above $1,835.
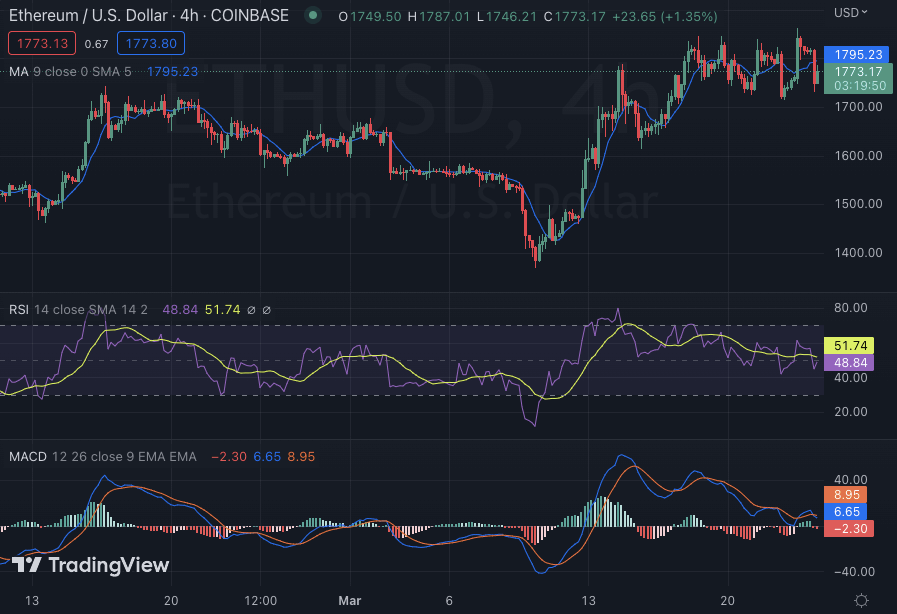
The technical indicators are also bullish and suggest that the bulls can make further gains in the near term. The moving average converges divergence (MACD) is strongly above the zero line in favor of the bulls, while the RSI is currently close to 50 levels. This indicates that oversold conditions could be about to be triggered. The 50-day and 200-day moving averages are still below the current price, indicating that a bull trend is in play.
Ethereum price analysis conclusion
Overall, Ethereum price analysis suggests that the bulls are back in control of the market and could push higher toward $1,835 in the near term. The technical indicators are also in favor of the bulls and suggest that ETH/USD could possibly break out of the resistance level soon. Support is seen at the $1,743 level and traders should watch for any potential price breakouts. If ETH/USD falls back below the $1,743 support level then selling pressure could increase.