The Chainlink price analysis shows a bullish trend in today’s trading session as LINK/USD has recovered to $7.56 after rejecting the resistance at $7.66 earlier on. The cryptocurrency is seeing strong buying pressure and is up by more than 1.55 percent in the last 24 hours. The bulls have managed to push the price above the key level of $7.50, which is a positive sign.
The immediate resistance for LINK/USD lies at $7.66 and if the bulls manage to break above this level, they could target $7.80. On the downside, there is strong support at $7.42 and if the bears manage to push the price below this level, then it could find further support around $7.40.
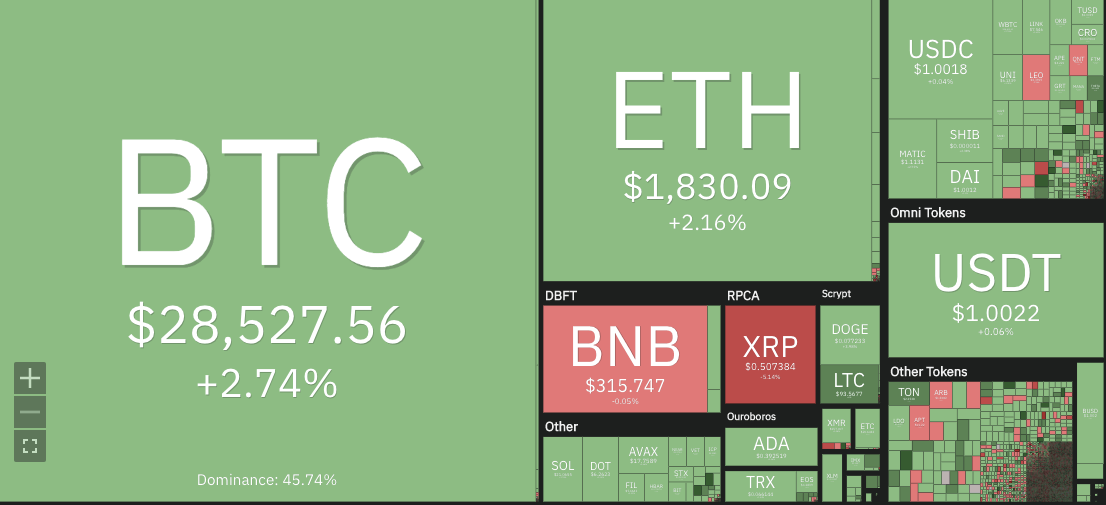
Most of the Cryptocurrencies are trading in the green, with Bitcoin (BTC) and Ether (ETH) continuing to lead the market. Ethereum’s price is up by more than 2.16% in the last 24 hours and it looks like bulls are back in control. If Chainlink continues to gain momentum, then it could reach new yearly highs soon.
Chainlink price analysis 1-day chart: LINK price moves above $7.50 after a bullish market
On the 1-day chart, Chainlink price analysis is trading above the level of $7.50 and has managed to break out from the ascending triangle pattern. The market opened trading today at $7.12 and has been steadily increasing since then. The green candles on the chart indicate that bulls are in control of the market and are likely to push the price higher.
The 24-hour trading volume for LINK/USD has also increased to $301 million and it looks like there is strong buying pressure in the market. The market cap for Chainlink stands at $3.89 billion and it looks like the bulls are determined to take the price higher.
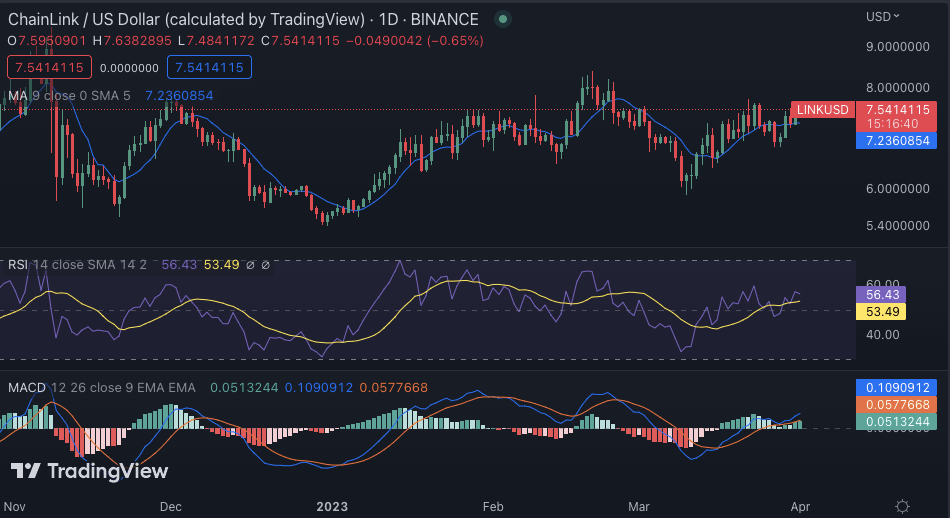
The daily technical indicators are also providing a bullish signal. The Moving average converges divergence (MACD) is in the positive region and the MACD line has crossed above the signal line. The relative strength index (RSI) is also trading well above 50, indicating that there is strong buying pressure in the market. The moving average indicator is also in the bullish region and is trending higher, indicating that the bulls are in control of the market.
Chainlink price analysis 4-hour chart: LINK struggles to break above $7.60
On the 4-hour chart, Chainlink price analysis is trading in a range between $7.42 and $7.66 in the past few hours. The previous day the bearish pressure pushed the price below $7.50 as more selling pressure was seen in the market. However, the bulls managed to push the price back above $7.50 and it looks like they are now aiming for a breakout at $7.60.
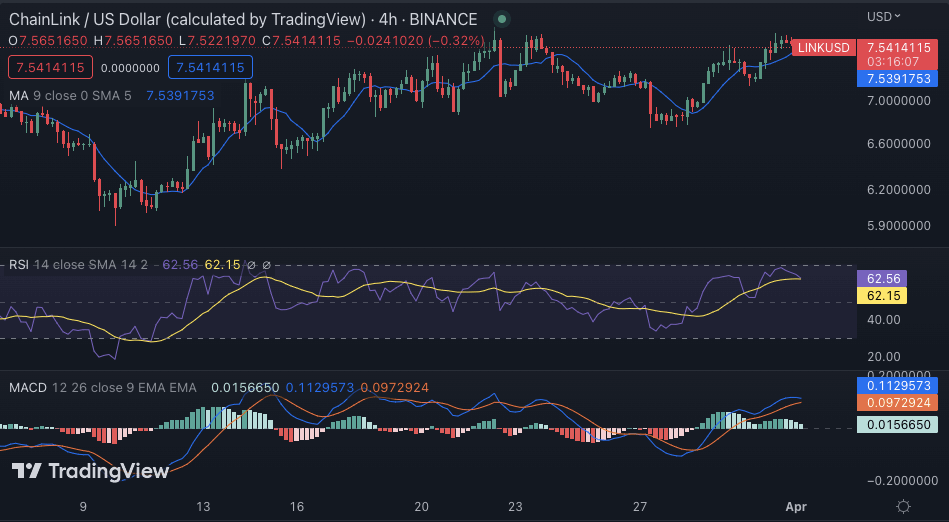
The technical indicators on the 4-hour chart are mostly providing a neutral signal, with the MACD line and signal line being almost flat. The RSI is also trading around 62.56 and is not giving any clear signal at this point. The moving average indicator is below the price action, indicating that bears could have an upper hand for the short term.
Chainlink price analysis conclusion
Overall, Chainlink’s price analysis shows that the bulls have managed to push the price above $7.50 and now they are looking for a break above $7.60. If the bulls manage to break above this level, then LINK/USD could aim for new yearly highs in the coming days. The technical indicators are also mostly providing a bullish signal and this could be the trigger for LINK to break major resistance.