Following a solid recovery seen yesterday, today’s price is down, according to Polkadot price analysis. The price broke down today, falling from $6.36 to $6.27, and DOT/USD hasn’t found support yet. As the price declines, selling pressure has returned to the market. The DOT/USD was in decline over the previous week, but for the last few days, the price movement was upward; however, selling pressure has resumed, and the market experienced a sell off.
DOT/USD 1-day price chart: Bears to dominate market movement
The Polkadot price analysis 1-day price chart reveals that since the start of today’s trading session, there has been a slight price deficit as bears have refrained from a further upward advance. Since the bulls were in control up until yesterday, the DOT/USD combination is currently trading at $6.27 and still reports an increase of 5.83 percent in value in the past day. While the trading volume has grown by 10.82 percent today, the coin has lost 0.16 percent over the last hour.
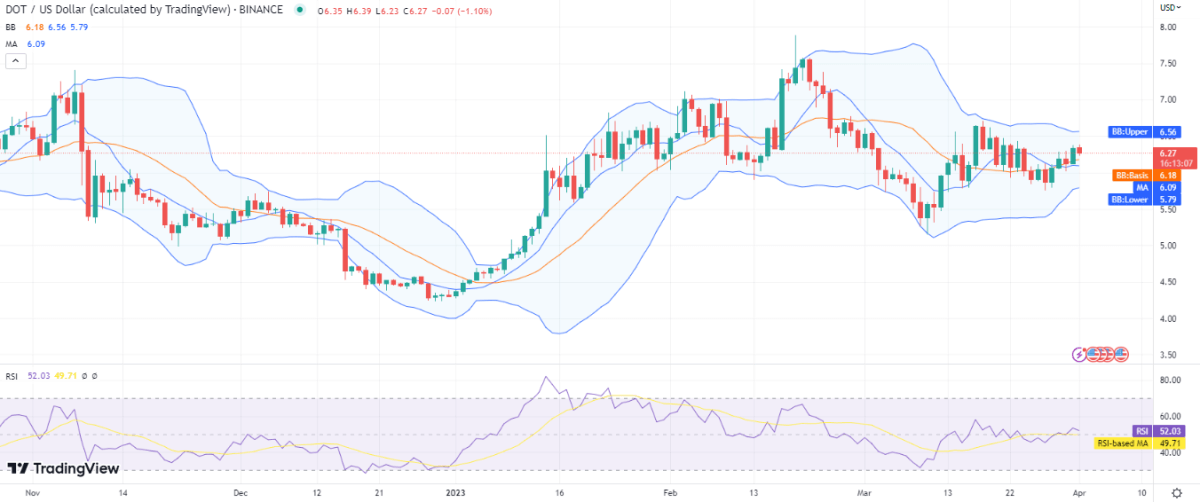
The Bollinger bands are moving forward after a strong covergence that was visible until yesterday, with the upper band at the $6.56 mark representing resistance and the lower band at the $6.0 mark representing support. This indicates that the volatility is relatively low. At the $6.18 level, below the price level, the average of the Bollinger bands is beginning to develop.
The relative strength index (RSI), which measures the intensity of the selling pressure in the market and, consequently, the selling activity, is bouncing around index 52 in the lower half of the neutral zone with a slight downward slope.
Polkadot price analysis: Recent developments and further technical indications
Given that the price began to decline at the beginning of the trading session and briefly swung low toward the $6.23 level, the 4-hour Polkadot price analysis reveals a bearish dominance. The price is currently trading at $6.28 and is still covering a downward range after a decline. If sellers apply more pressure, which has a good chance of happening, the price may fall even further.
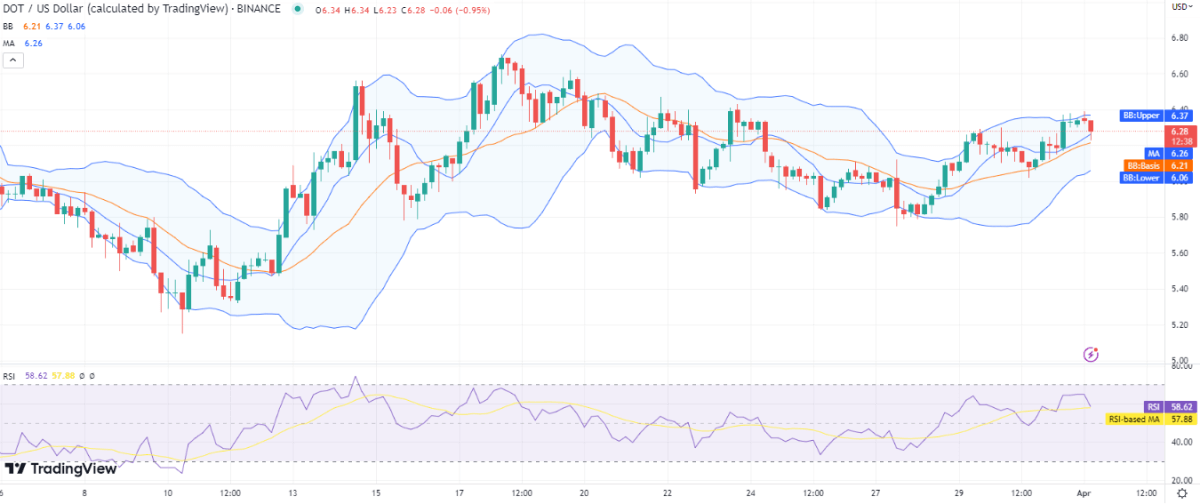
On the hourly chart, the Bollinger bands have also converged; the upper band has hit $6.37, and the lower band is at $6.06; the mean line of the Bollinger bands is below the price level. The RSI is at index 58, in the upper half of the neutral zone, showing the strength of the selling momentum as the indicator’s downward slope is ever-present.
Polkadot price analysis: Conclusion
It is clear from the Polkadot price analysis for the past 24 and 4 hours that the market is presently biased toward the bearish side, which is bad news for DOT. Therefore, given that the support is also nearby, we anticipate Polkadot’s price to decline further with a possibility of staying close to its current level.