Given that the price has dropped to $124.28 in the last four hours, the Bitcoin cash price analysis is strongly bearish for the entire day. The market has continued to collapse as the bears gradually regained momentum. The new bearish drive got its start yesterday when bears changed the trends to prevent the BCH price from rising beyond the $129 mark. Since then, the price has been moving downward, and today, a sell-off has also been seen, which has pushed the price lower.
BCH/USD 1-day price chart: A sell-off causes BCH to lose 1.30 percent more
The one-day Bitcoin cash price analysis report is in favor of the bears given that the price has fallen to $124.28 today. Market patterns have traditionally undergone frequent adjustments, but these recurrent confrontations have ultimately resulted in the bears seizing the initiative. The coin lost 1.30 percent more of its worth today as the price dropped further. The little 1.71 percent reduction in trading volume led to a 0.20 percent market dominance.
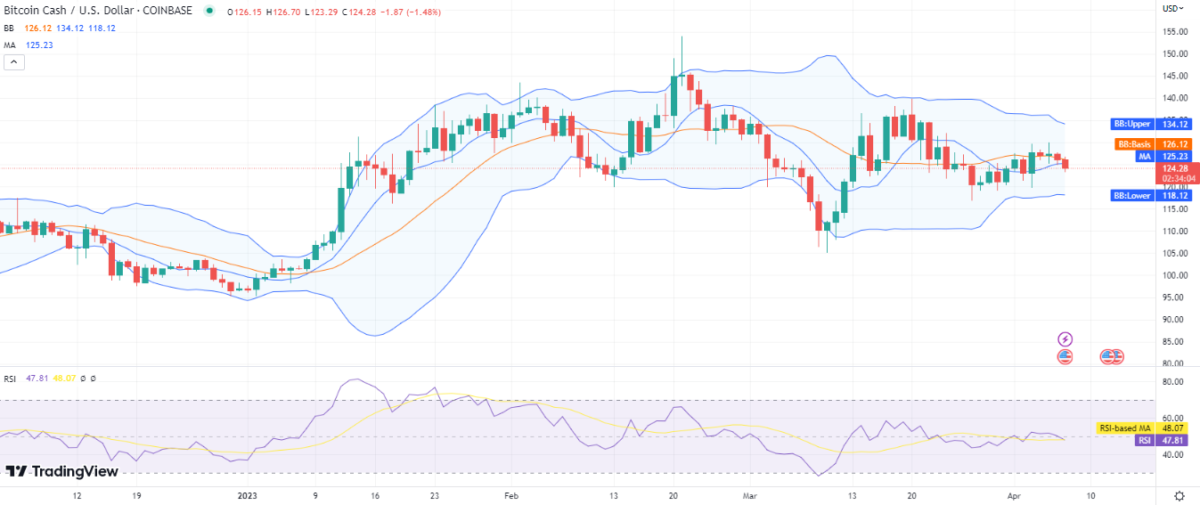
After coming close to the SMA 50, the moving average (MA) value is settled at $125. The 1-day price chart shows that volatility is declining, which suggests that adverse conditions could arise in the future. The top band of the Bollinger bands, which represents BCH’s resistance, is set at $134, while the lower band, which represents BCH’s support, is at $118. The price level has dropped below the indicator’s mean average line. Additionally, the RSI score has dropped to index 47, and the indicator is currently trading with a little downward curve.
Bitcoin Cash price analysis: Recent developments and further technical indications
The four-hour Bitcoin cash price analysis shows that the bears are once again in control. Due to the decline, the price of the cryptocurrency dropped significantly, reaching a low of $124.29. For the past 48 hours, the price function has been declining as the bearish momentum has gotten stronger.
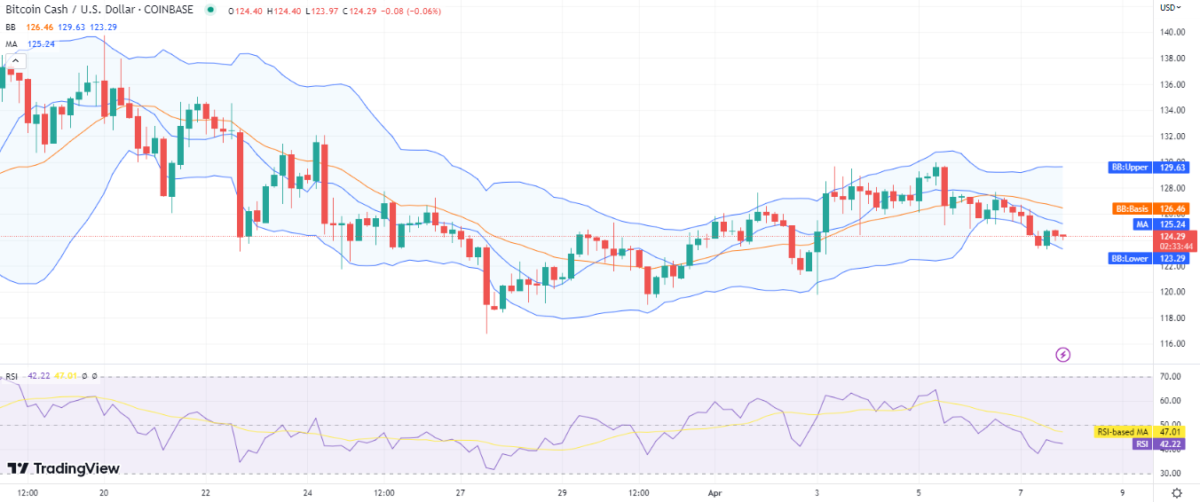
The moving average (MA), which is still trading below the SMA 50 curve, is displaying its value at $125.24. The Bollinger bands also generate an average of $126.45. The Bollinger Bands’ upper strand is currently around $129, while the lower strand is currently approaching $123. The area between the Bollinger bands is expanding, which indicates a rapid rise in volatility. The RSI indicates that the coin is currently experiencing selling pressure because the bearish pressure is causing the RSI score to decrease, and it has reached index 42 in the lower half of the neutral region.
Bitcoin Cash price analysis conclusion
The one-day and four-hour Bitcoin cash price analysis have revealed that the bears have persisted in their march today. As the bears are in control, the price levels have been steadily declining. The price has dropped to $124.29, which has had a detrimental impact on the BCH market value. The bulls may eventually have the upper hand in the future due to the support level at $120.