According to the Uniswap price analysis, the bearish momentum is once again accelerating. The price has significantly dropped over the last week, and today’s pattern is continuing that downward trend. Today’s price decline to $5.85 has done significant damage to the value of the cryptocurrency. The coin has been fighting to keep its price levels for the past four days, but there is a good likelihood that it will continue to fall, with support perhaps coming in at $5.79.
UNI/USD 1-day price chart: Bears continue plunging down the price levels
The 1-day Uniswap price analysis shows that the bears have continued their lead for the fourth day today. The trend has been downward since the price last peaked at $6.22 on April 5, 2023. The bears have successfully been able to tackle the market and have once again secured their winning position. The price has undergone a decrease and is now present at the $5.85 level, losing 3.13 percent of its value over the last day. Meanwhile, the moving average (MA) is higher than the price value, i.e., $6.02, because of the downtrends in the past week.
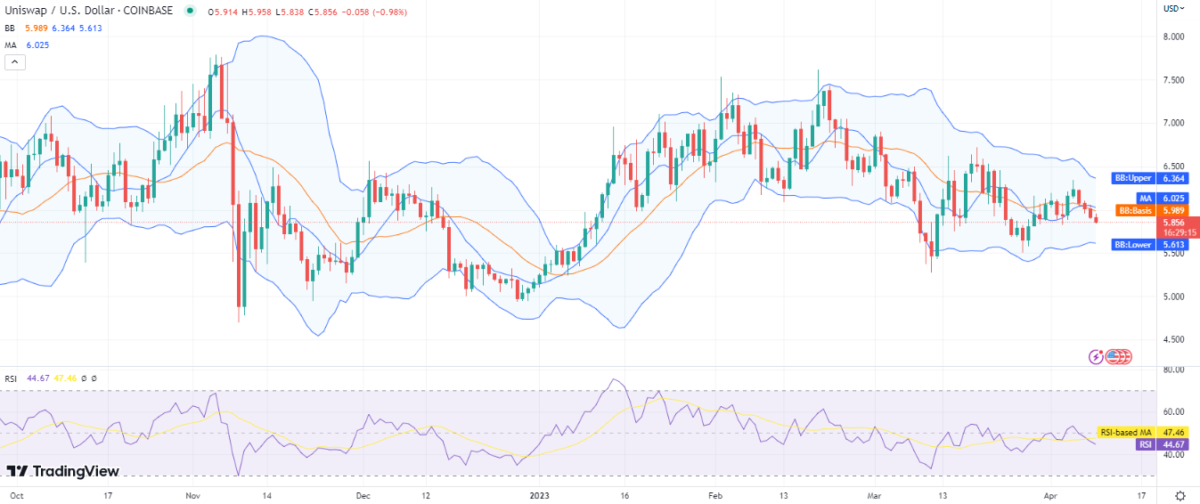
The volatility has slightly decreased but is still comparatively high as the Bollinger bands are expanded over a larger area. This has led to the upper Bollinger band stepping down to the $6.36 level, representing resistance, and the lower Bollinger band maintaining a $6.61 value, representing support. The Relative Strength Index (RSI) has dropped to index 44 today, indicating selling activity, and is once again confirming the downward trend.
Uniswap price analysis: Recent developments and further technical indications
The 4-hour Uniswap price analysis shows that the price has fallen today as well, and the bears are retaining their lead rather firmly. At the current price of $5.85, it is anticipated that the price will soon decline. A significant negative indicator is the short-term trending line’s downward movement. On April 7, 2023, bulls tried to elevate the price levels but were unsuccessful in doing so. The moving average is above the price level, i.e., at $5.95 as compared to the price level. At the same time, the Bollinger bands average is also found resting at the $6.02 level for today.
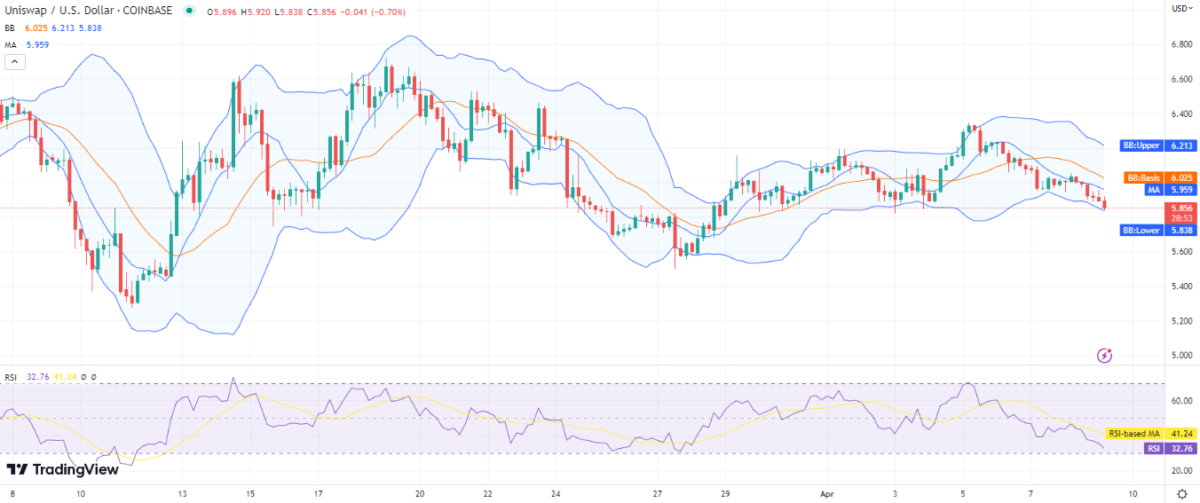
The volatility is high, with both the arms of the volatility indicator moving downwards. This has resulted in the upper Bollinger band going to the $6.21 value and the lower Bollinger band reaching the $5.83 value after traveling downward. The indicator also hints at the possibily of more damage in the coming days. The RSI score is also moving downwards below the centerline of the neutral range towards the undersold range is right now present at index 32.
Uniswap price analysis
The bears are in a winning position at present, as can be confirmed from the one-day and four-hour Uniswap price analysis. At the time of this writing, the value of the Uniswap has decreased and is now $5.85. Since the downtrend hasn’t changed in a few days, it is expected to continue for some time. In the upcoming hours, the price is expected to retest the $5.79 support level.