The Litecoin price analysis reveals that the LTC/USD pair has started to gain bullish momentum after a period of consolidation at around $96.85. Although the bears were in control of the market for most of the past week, they were unable to push the price lower at the $95.65 support level, leading to a strong rally. The bulls are now trying to take advantage of this momentum and are pushing the price higher. The LTC/USD pair is currently trading at $96.88, which is about 0.25% higher than the previous week’s low.
The LTC/USD pair has been trading in a range between $96.88 and $96.91 for most of the past week and is currently trading close to the upper limit of this range. This suggests that the bulls are starting to gain control of the market, however, there is still some resistance at the $98.25 level which needs to be broken for further upside.
Litecoin price analysis 1-day price chart: LTC/USD trades at $96.88 after a bullish run
The 1-day Litecoin price analysis shows that the LTC/USD pair has been trading in a rising wedge pattern since the beginning of yesterday. The support for LTC/USD pair is currently at the $95.65 mark, which was the low of April 10th. The resistance for this pair is at the $98.25 level which has been tested several times in the past week. If the bulls can break above this resistance, then we can expect a strong upward move toward the next major resistance at $98.54, which is a likely target for the bulls in the short term.
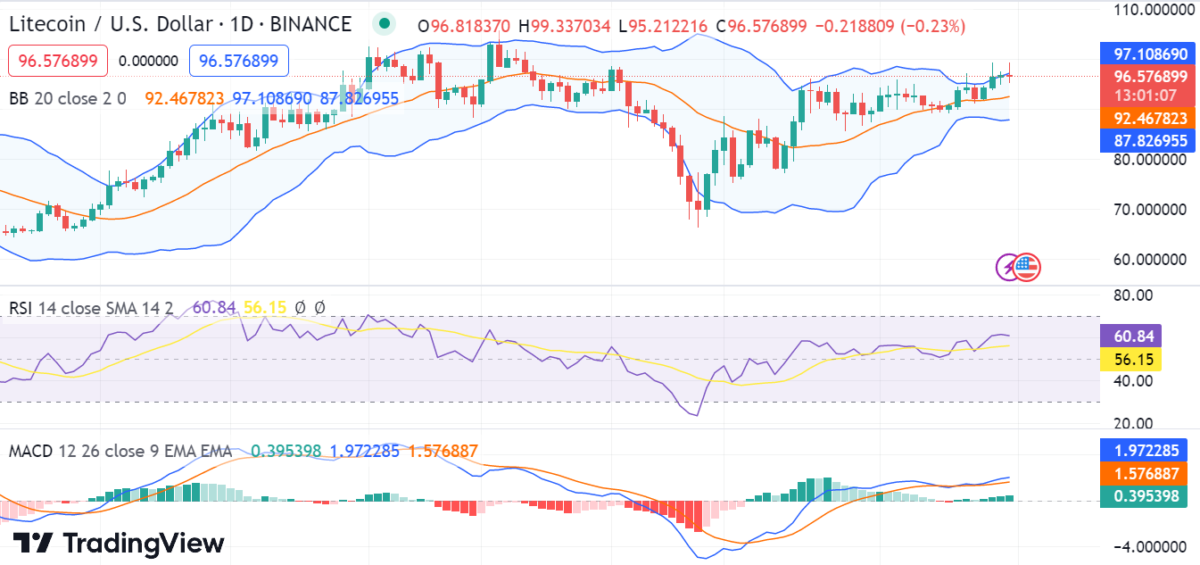
The MACD line is above the signal line, which indicates that the bulls are in control of the market momentum. The Relative Strength Index on the 24-hour price chart is currently near the 60-level, which indicates that the market is in the overbought region. However, since the RSI is not at extreme levels, there is still some room for prices to move higher. The bulls have been in control of the market as the Bollinger Bands are moving above the candlesticks.
LTC/USD 4-hour price chart: Recent development and further technical indications
The 4-hour Litecoin price analysis shows that the LTC/USD pair has formed a bullish flag pattern, which is a continuation pattern. The breakout from this pattern suggests that the bulls are trying to take control of the market and push the price higher. The coin today started trading at $96.80 and has reached a high of $96.88, which is a gain of 0.25 percent. The market capitalization currently stands at $7.04 billion and the 24-hour trading volume is over $440 million.
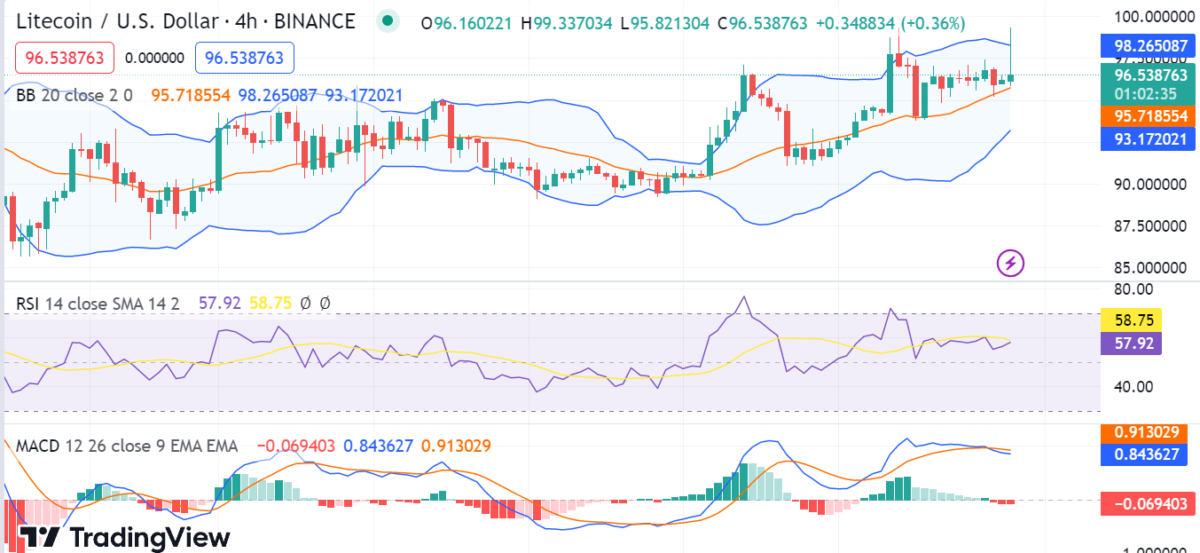
The Bollinger Bands are also expanding, which is indicative of increased market volatility. The Moving Average Convergence Divergence line is on the brink of a bullish crossover, which is a positive sign for the market. The MACD histogram is also in green, which indicates that the bulls have the upper hand in the market at the moment. The Relative Strength Index is currently near the 50-level, which indicates that the market is neither overbought nor oversold.
Litecoin price analysis conclusion
To conclude, Litecoin price analysis shows that the LTC/USD pair is in a strong uptrend and could be heading toward further gains. The bulls need to break the $98.25 resistance level for a continuation of the uptrend. The technical indicators on the 4-hour chart are all in favor of the bulls and suggest further gains for the coin.