The Uniswap price analysis shows a downtrend in the price action as UNI devalued to $6.27 in the past 24 hours. UNI is trading between a narrow range of $6.27 to $6.45, but earlier on the bulls had taken control and pushed the price up to $6.45 which is the current resistance level. The digital asset has lost nearly 0.77% in the last 24 hours and appears to be consolidating above the $6.20 level at the time of writing.
The significant resistance levels are expected around the $6.45 area, but the bears remain dominant at this point and further downside pressure is likely to come if buyers do not reclaim control of the market momentum soon. On the downside, the key support level for UNI/USD is seen at $6.18 and a breach below it could retrace the $6.00 level.
Uniswap price analysis 24-hour chart: UNI face resistance at the $6.45 mark
The 24-hour chart for Uniswap price analysis shows a bearish trend in the market with UNI/USD price declining. The buyers are expected to reclaim control if they hold on to the current support level and shoot up the price toward its resistance level of $6.45. UNI’s trading volume has been relatively low in the past 24 hours with the market cap on a decrease too as it stands at $3.62 billion.
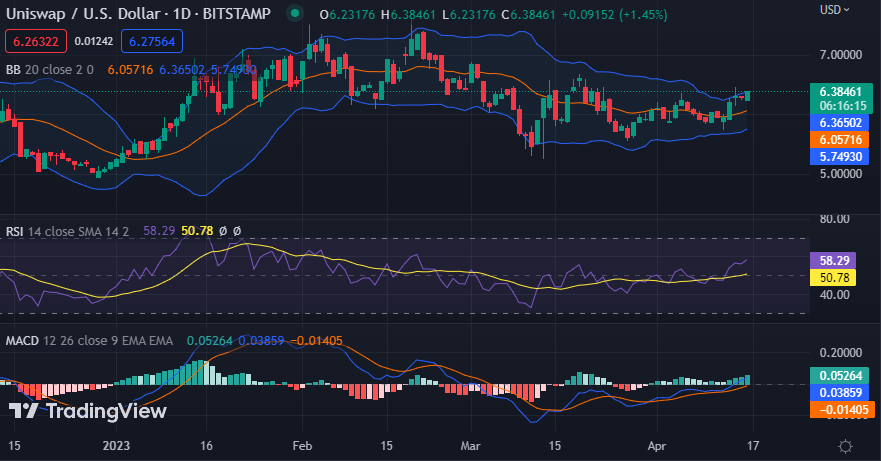
The moving average convergence divergence or MACD indicator shows a change in direction as it has started sloping towards the bearish territory. The Relative Strength Index (RSI) is above the 50 levels indicating a slightly bullish bias in the trading sentiment as the buyers are getting into action. The Bollinger Bands have reduced size as the price action moves towards the downside, which suggests that UNI may remain range-bound in the near term.
Uniswap price analysis 4-hour chart: Latest developments
The hourly chart for Uniswap price analysis shows that the bulls are gaining control as the price action moves. UNI is trading above the $6.20 range and is trending upwards as the buyers aim for the $6.45 resistance level.
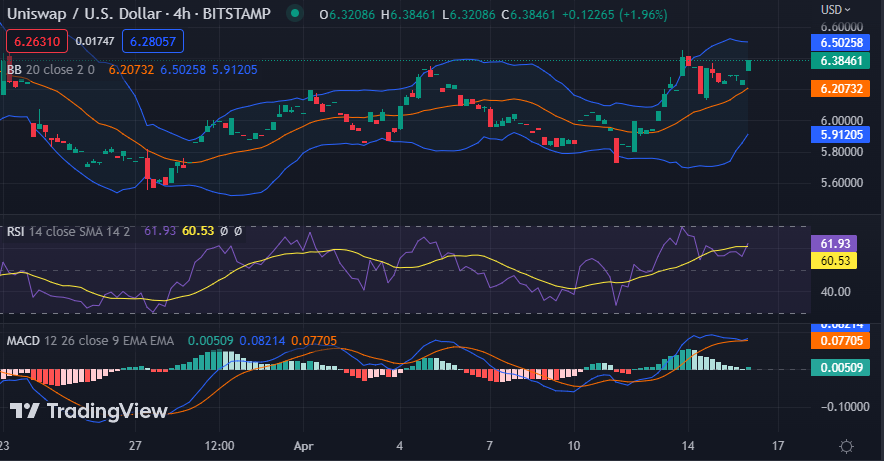
On the technical indicators, the MACD on the 4-hour chart is sloping towards the bullish side suggesting that buyers are getting into action and aiming to eliminate the bearish pressure. The Relative Strength Index is currently at 61.93 pointing out that the market has seen an increase in bull’s activity. The Bollinger Bands have expanded as the volatility increases and shows UNI may move to either side of the spectrum depending on which party holds power in the short term.
Uniswap price analysis conclusion
Overall, Uniswap price analysis shows that UNI has been in a bearish trend for the past 24 hours and is trading below its resistance of $6.45. The buyers are expected to take control if they hold on to the current support level and push up the price towards its resistance level. A breach above the resistance level of $6.45 could open up a possibility for further gains in UNI’s price.