
The Dogecoin price analysis indicates an increase in its value today. The price levels have increased again bulls continue their lead after the previous trading session, which resulted in a slight decrease. The overall momentum continues to be positive, with the price reaching an intraday high of $0.08989 and trading at the time of writing just above the level. The bulls have managed to breach a crucial resistance level at $0.09077, which is likely to act as the next support if the price retraces. The digital asset has gained momentum up to 1.23 percent in the past 24 hours. The 24-hour trading volume for DOGE has declined by 6.15% and is now $506 million, and the market cap rests at $12.5 billion.
Dogecoin price analysis 1-day chart: DOGE price remains firm at $0.08989 following a bullish signal
The 1-day price chart for Dogecoin price analysis shows the cryptocurrency analysis is going in a bullish direction with a higher high and higher low formation. The price has increased to $0.08989 as the coin gained 1.23 percent of its value during the last 24 hours. As the trend continues, the price may reach $0.092, while support levels are expected to hold at around $0.08830.
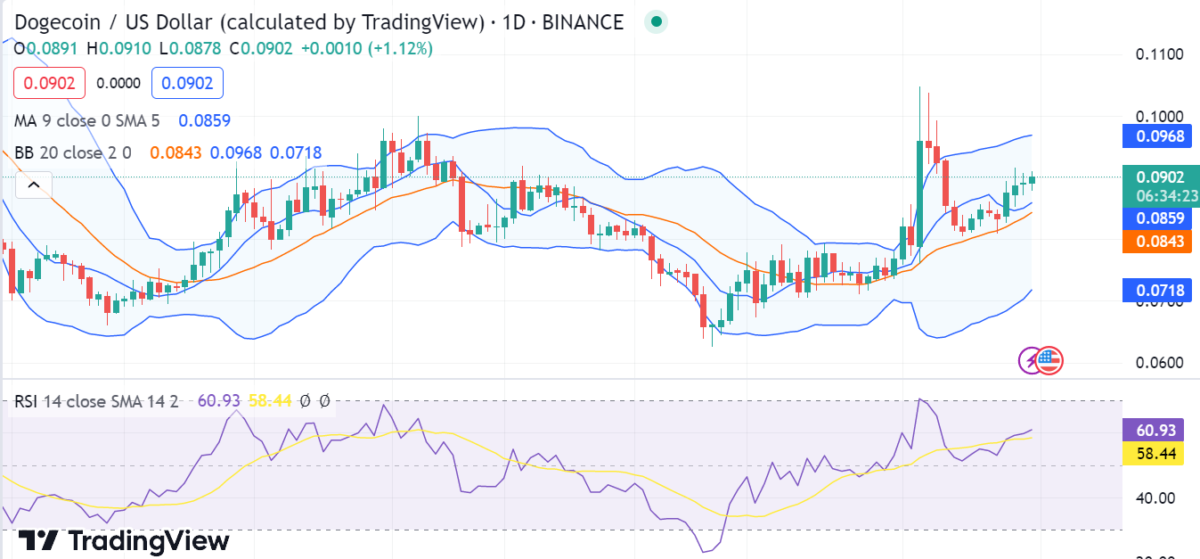
The moving average, on the other hand, is currently at $0.0859 which is below the current price value, indicating that buying pressure is still present in the market. The volatility is increasing, which suggests that a downfall in price might occur in the next few days. The upper band of the Bollinger Bands Indicator is present at a $0.0968 high, whereas its lower band is present at a $0.0718 low. The relative strength index (RSI) score is 60.93 indicating that the current price is in overbought territory.
DOGE/USD 4-hour price chart: Bulls push the price higher after a strong bullish run
Looking at the 4-hour Dogecoin price chart favors the bulls as a significant improvement in coin value is observed. Green candlesticks are forming a series, suggesting that buyers are driving the market. The price is expected to break the current resistance level at $0.09077 if bulls continue to lead the market. The bullish momentum has been continuous, and the price has been gradually moving upward for the last 4 hours to reach $0.08989 currently.

The relative strength index (RSI) indicator is currently at 60.19, indicating that Dogecoin is in the neutral zone and has not yet entered the oversold or overbought territory. The Moving Average (MA) indicator is trading at $0.0894, with a bullish crossover occurring during the previous trading session as the MA 50 crossed over the MA 200. The upper Bollinger Band is present at $0.0911, while the lower band is currently placed at $0.0867, suggesting that buyers are mostly in control of the market.
Dogecoin price analysis conclusion
In conclusion, the Dogecoin price analysis suggests that the price is likely to reach a new high if the bulls continue to lead. The price is also expected to break out of its current trading range and reach a new resistance level at $0.09077, or even higher. Support levels are expected to hold if the price retraces and traders should continue to follow the market trend.


