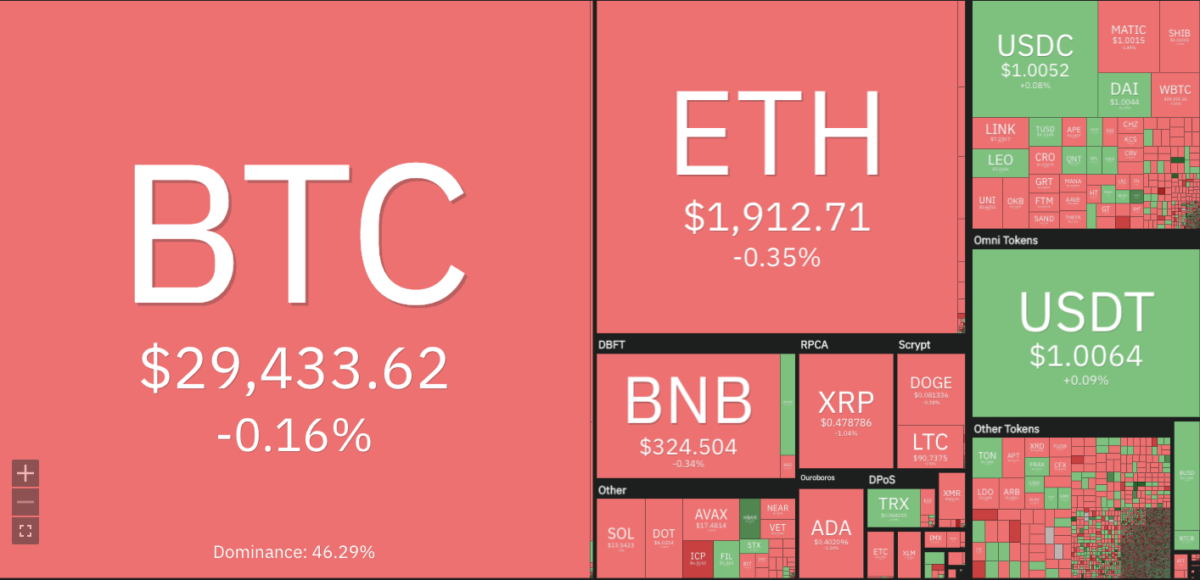
On April 26, the cryptocurrency market experienced significant volatility due to rumours about large amounts of Bitcoin being transferred from wallets linked to the no longer functioning Mt. Gox exchange and the US government. However, it was slightly positive that Bitcoin and certain alternative cryptocurrencies maintained their support levels.
Traders may be looking to take profits following Bitcoin’s significant increase in value in 2023. Coinglass has observed that the amount of Bitcoin held at Binance has increased by 50,000 within the last 30 days.
Although there may be some short-term pressure, bullish investors can be comforted by the fact that the increase in Bitcoin balance is not the same across all exchanges. According to Coinglass, the total increase in Bitcoin balance across all exchanges was 14,000 Bitcoin.
The upcoming U.S. Federal Reserve meeting on May 2 and 3 is expected to be the next big event for the market. According to the FedWatch Tool, there is a 90% likelihood that there will be a 25 basis point rate increase during the meeting. Many analysts anticipate that this will be the last rate hike before a shift takes place later in the year.
The BTC price analysis shows that the cryptocurrency has been trading in mixed signals in the past few days with bearish and bullish pressure. Despite the current price correction, the long-term outlook for Bitcoin remains bullish.
The Ethereum analysis shows that Eth is trading right above $1,900 and has been oscillating in a sideways range for the past few days this week. The coin has made minor attempts to break above this level but it was unsuccessful due to profit-taking by investors. The other top coin like Ripple and Binance has been trading in a range-bound channel.
Dogecoin has seen significant volatility this week due to the frenzy created by some celebrities such as Elon Musk, who are actively promoting it on social media platforms. Despite these developments, Dogecoin remains highly volatile and is down more than 10 per cent in the past seven days. Cardano has been trading in mixed signals this week in the range of $0.3828 to $0.4167 level and is expected to remain in this range in the coming days.
BTC/USD
Bitcoin price analysis shows that the pair is slowly coming out of the recent slump and is attempting to break above $30,000. Currently, Bitcoin is trading at $29,433 and if it continues to make higher highs, then we could see a retest of all-time high levels in the near term. On 24 April the BTC price dropped to $27,005, which was low in the last seven days. However, the bullish momentum and buying pressure pushed the pair back above $29,000.
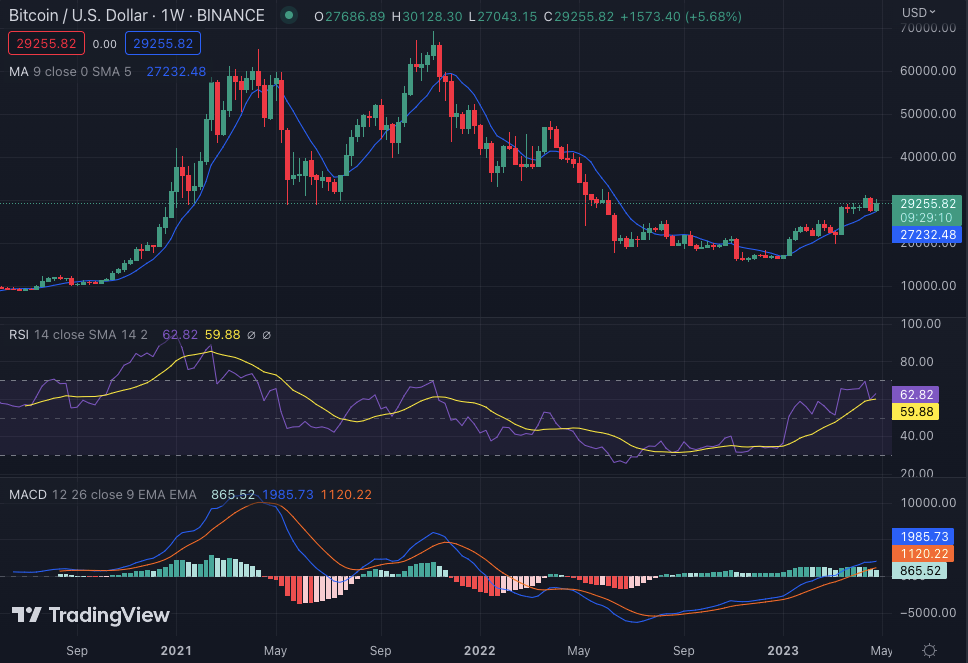
The 20-EMA has provided strong support and if buyers can break above the $30,000 level then we could see a retest of all-time highs. On the downside, the immediate support level is around $29,088 while further major resistance is seen near $29,356.
The weekly technical indicators are giving a slightly mixed signal as the RSI is still below 60 while the MACD has crossed above zero. The buying pressure indicated by the MACD suggests that traders are looking to buy BTC on every dip toward the $29,000 level. The weekly moving average indicator is seen at $27,232.
ETH/USD
Ethereum Price Analysis shows that Ethereum is trading near $1,912 and has been consolidating in a wide range of $1,800 to $1,900 in the past few days. Despite some minor bearish pressure, the coin has been trading in a bullish trend since the beginning of this month.
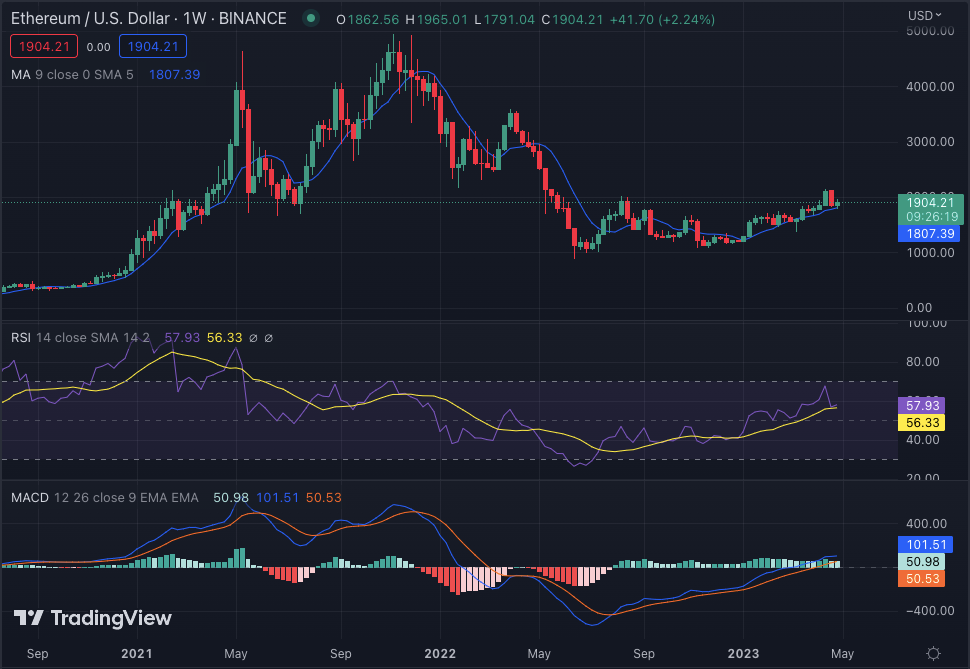
The MACD indicator is giving a slightly bullish signal as it goes above zero and continues to stay there for the past two weeks. The RSI has already crossed above 50 while the weekly moving average is seen at $1,807. The 50-Weekly moving average is slightly higher at $1807 and is likely to provide strong support if the price drops.
XRP/USD
XRP price analysis shows that the coin has been trading in a range-bound channel between $0.4425 and $0.485 level since the beginning of this week. The bearish and bullish have been oscillating with the bears trying to push the coin below $0.45 while the bulls have been attempting to break above this level.
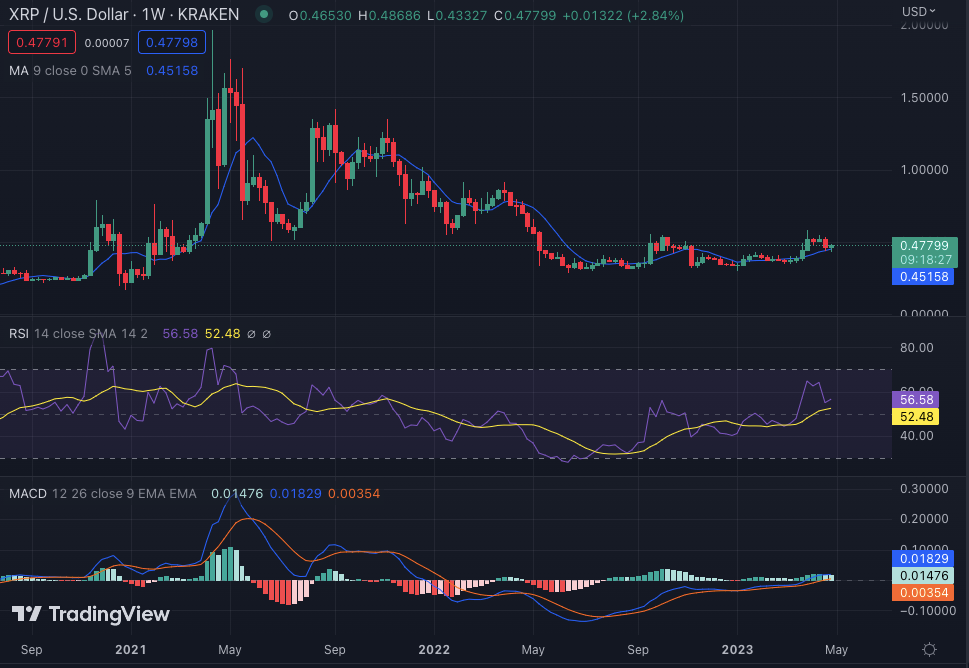
At the time XRP/USD is trading at $0.4748 and is down by 0.50 per cent in the past 24 hours. The weekly technical indicators are giving a mixed signal as the RSI is seen at 56.58 levels indicating a neutral signal. The weekly moving average indicator is seen at $0.451 and if the price drops below this level then we could see a further correction in XRP. The moving average convergence and divergence have been in mixed signals for the past few days.
BNB/USD
Binance Coin Price Analysis shows that BNB is trading at $322.36 and has been trading in a range-bound channel between $320 and $344 in the past few days. The coin has been making minor attempts to break above this level but without any success. The coming days will be crucial for BNB as it will be interesting to see if buyers can break above the resistance zone or not.
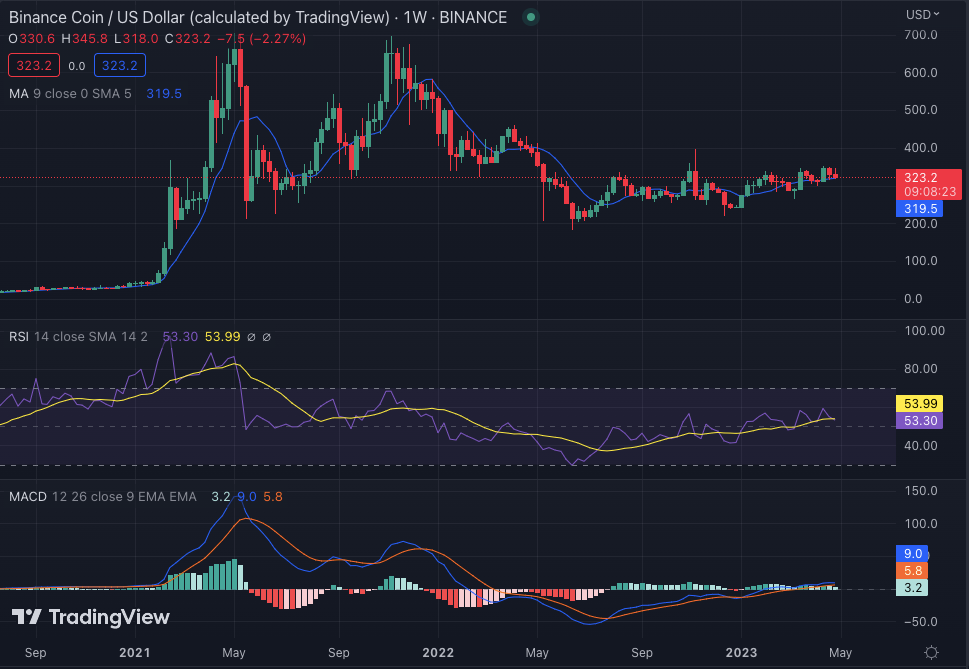
The weekly technical indicators are looking slightly bearish as the RSI has been hoovering near the neutral level of 53 with bullish and bearish pressure alternating. The MACD indicator is in negative territory and is seen near the zero line. The 20-Weekly moving average is seen at $319 while the 50-Weekly moving average is slightly higher at $323. This level could act as key support if the price drops in the coming days.
DOGE/USD
Dogecoin Price Analysis shows that DOGE is trading at $0.08095 and has been trading in a range-bound channel between $0.0766 and $0.0822 since the beginning of this week. The bulls have been attempting to break above this level but without any success as the bears have been defending strongly.
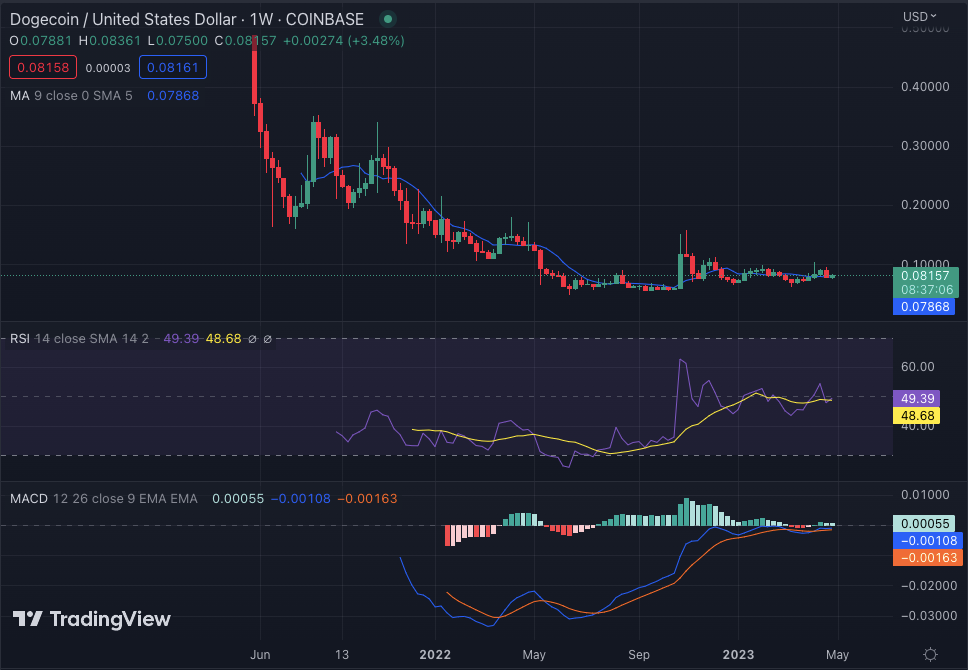
The Resistance level for Dogecoin is seen at $0.08185 while the support level is near $0.08086. The weekly technical indicators have been in neutral territory as RSI has been hovering near 50. The 20-Weekly moving average is seen at $0.07868 while the 50-Weekly moving average is slightly higher at $0.08161. The EMA crossover indicates that the buying momentum has been building in the coin. The histogram of the MACD indicator is also seen above zero indicating a buying pressure in the coin.
ADA/USD
Weekly crypto price analysis of ADA/USD shows that the coin is trading at $0.4002 with a weekly 0.80 per cent decrease. The selling and buying pressure has been oscillating in the past few days as the bulls have been trying to break above $0.4 while the bears keep pushing it back down.
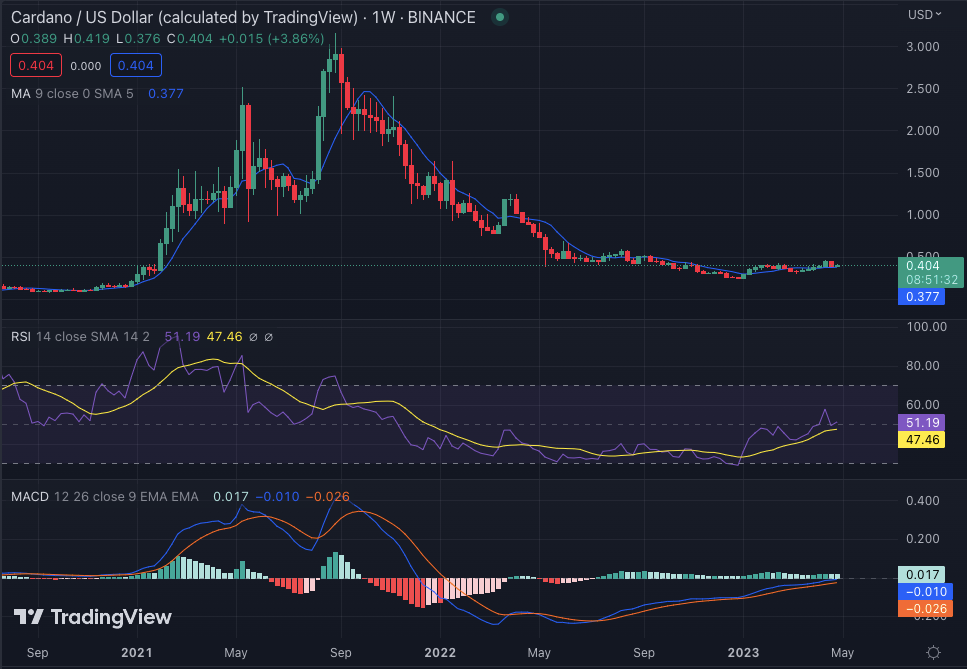
The weekly technical indicators are looking neutral as RSI has been hovering near 50 with no clear indication of either buying or selling pressure. The MACD indicator has been seen in a bearish trend as the histogram is turning negative. The EMA crossover also indicates that buying momentum has been slightly decreasing in the coin.
Weekly Crypto Price Analysis Conclusion
To sum up the weekly crypto price analysis, we can see that all the coins are trading in a range-bound channel with minor buying and selling pressure. The weekly technical indicators for all the coins are in neutral territory with no clear indication of direction. If the price breaks either above or below these range-bound channels, then we could see a more decisive direction for all the coins.