The Aptos price analysis reveals the price has been trading low since yesterday, with the market having formed lower highs and lower lows. The bears have remained in control during this period, causing a continuous decrease in price. As of writing, APT is trading below $10.00 as more selling pressure is being seen.

The APT/USD is trading at $9.92 and is down by 1.91 percent in the past 24 hours. The bears have managed to break the $9.83 support level and the market could go further south if more selling pressure continues to be seen in the near term. On the upside, APT has strong resistance at $10.17 which has been proving to be a difficult level for the bulls to break through.
Aptos price analysis 1-day price chart: APT trades in red as bears remain in control
The Aptos price analysis 1-day chart shows that APT/USD has been trading in the red zone for most of the day. The previous week the market was favourable for the buyers as the bulls managed to break through above the $10.00 level, however, since then a steady decline has been seen in price which is an indication of a bearish trend.
The trading volume for the APT/USD market has also declined significantly over the past 24 hours. Currently, it is at $116 million which is much lower than the previous day. Looking at the market capitalization, APT has a total market cap of $1.87 million which is down by 1.95 percent in the last 24 hours.
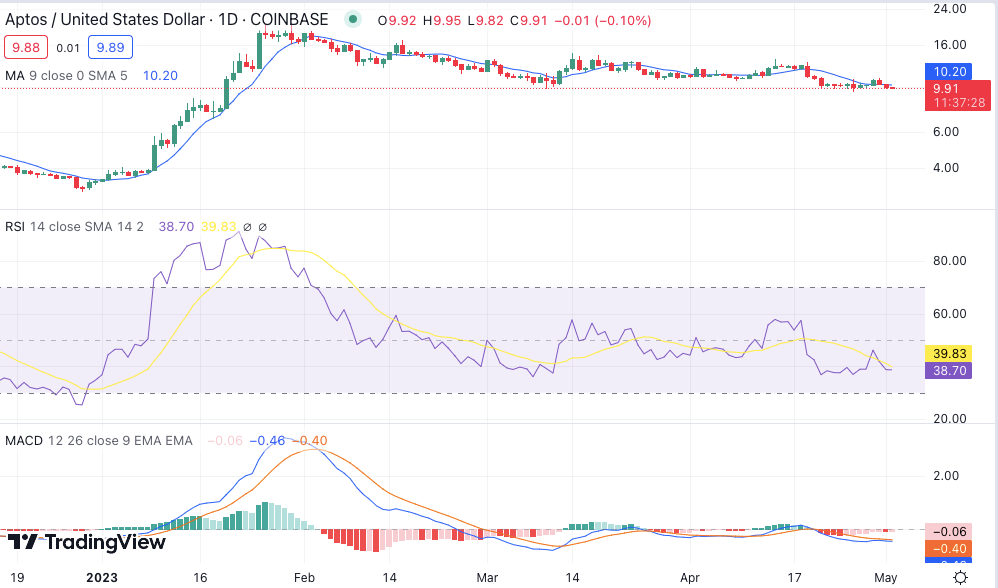
The moving average indicator on the daily chart is sloping downward which indicates that the bearish trend might continue in the near term. The 50-day MA is currently below the 200-day MA which is another indication of an ongoing bearish trend. If these trends continue, APT could sink further in the coming days. The MACD indicator is also in the bearish zone and has been trading below the signal line since yesterday. The RSI is currently at 38.70, indicating that the market is in neutral territory.
Aptos price analysis: Recent developments and further technical indications
The four hours Aptos price analysis is declaring the bearish lead as the price has decreased consistently during the last 24 hours. A downward trend has been going on as the price has moved down to the $9.92 level. The price has decreased significantly as the bearish momentum has been intensifying for the last few days.
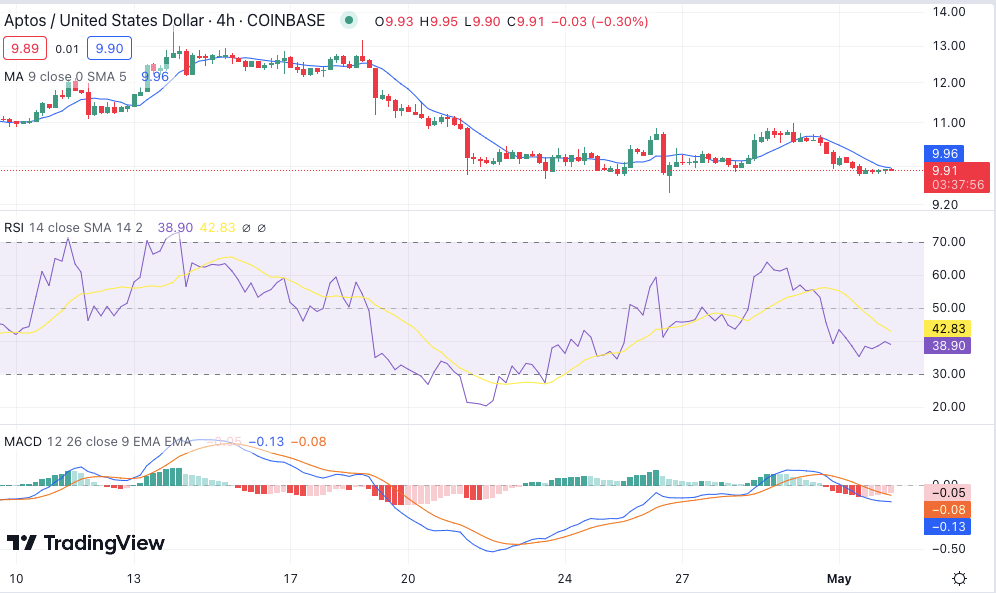
The moving average in the four hours price chart is standing at the $9.96 level, with 20-EMA and 50-EMA trending below the 200-EMA. This suggests that a bearish trend is likely to remain active in the near term. Furthermore, the MACD indicator is also demonstrating a negative crossover and is trading below the signal line. The RSI has also dropped below the 50-level, indicating that a bearish trend is taking control of the market.
Aptos price analysis conclusion
The price experienced bearish progression today, as confirmed by the Aptos price analysis. The bearish trend is likely to remain active in the near term as the technical indicators are pointing towards a negative sentiment in the market. The resistance for APT/USD is currently at $10.17, and if this level continues to hold, the bearish pressure could drive the price further downside. On the other hand, if this level is broken, the bulls could gain control and push the price back to $10.00 or higher levels.