

The Polkadot price analysis is bullish for today as the bulls have taken the lead to propel DOT’s price to a high of $5.68. This marks an impressive 1.49 percent increase in just 24 hours and is likely indicative of further bullish sentiment for DOT in the coming days. The DOT/USD pair is currently trading around $5.60 level, where strong support is present for the cryptocurrency to hold above this price level and continue its upward momentum.
The market capitalization for DOT/USD has also seen an increase to $6.71 billion, placing it at the 11th spot on CoinMarketCap’s rankings. This is also reflective of a strong bullish trend as more and more investors are piling into Polkadot in anticipation of further gains. The trading volume for Polkadot has also seen a sharp uptick in the last 24 hours, with it currently sitting at $120 million.
Polkadot price analysis 1-day chart: Bullish efforts help DOT gain significant value
The 1-day price chart for Polkadot price analysis shows an increase in price for today. The market opened today at $5.65 and has since seen a steady increase in price throughout the day, before peaking at its current price of $5.68. The support levels for DOT/USD are currently at $5.60, with strong resistance being faced at the $5.81 level, indicating that further bullish sentiment is likely to continue in the coming days as the range of support and resistance for DOT/USD widens.
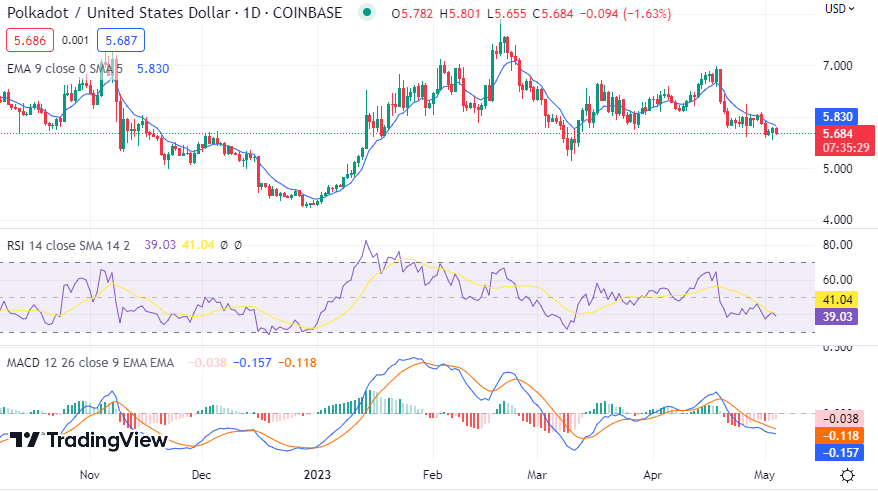
The technical indicators also show that further upside is likely as the MACD has been in a bullish outlook since yesterday with the red bars fading away and also reducing in size while the RSI is still below 50 and could continue to rise over the course of the next few days. The exponential moving average has also seen an uptrend since yesterday, indicating that the bulls have been able to secure a strong foothold in the market and are likely to continue pushing prices higher in the coming days. The 20-EMA is currently below the 50-EMA, indicating that the bulls still have some way to go before they can secure a strong lead in the market.
Polkadot price analysis: Recent updates as bullish sentiment continues
The 4-hour Polkadot price analysis shows the bulls are trying to maintain the upwards trend, as the price has managed to remain above $5.60 for the majority of the hours today, with only minor dips below this level. If bullish sentiment persists, then we could see DOT/USD reach the resistance level of $5.81 in the coming days, on the downside, the support level of $5.60 should be enough to prevent any significant losses for now.
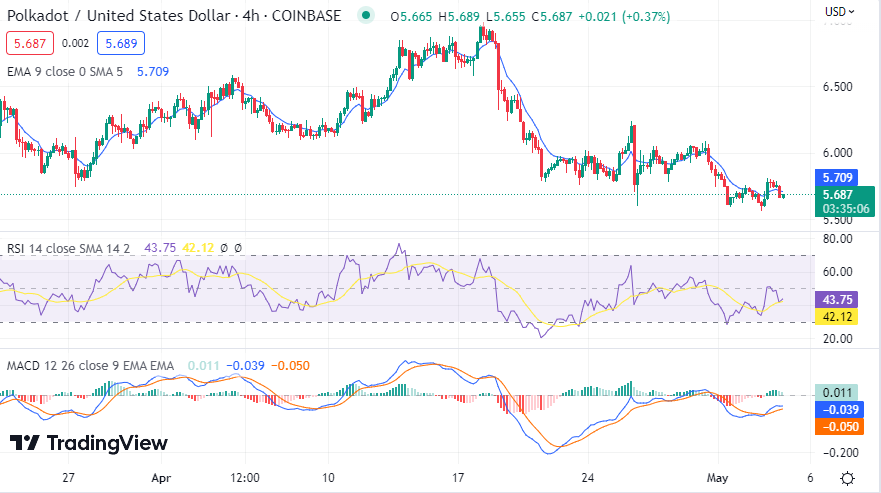
The moving average convergence divergence (MACD) for the 4-hour chart still looks bullish, with the signal line staying above the histogram, indicating that buyers still hold an advantage over sellers. The relative strength index (RSI) is at the 43.75 level, showing that the market is neither oversold nor overbought at the moment. This means that any sharp price movements could be likely in either direction in the near future.
Polkadot price analysis conclusion
The Polkadot price analysis suggests the DOT price has been recovering at a slow pace, but bulls are not letting the price degrade steeply as DOT/USD is currently trading above the $5.60 support level. The strong resistance of $5.81 is preventing any sharp price movements in either direction, however, if bullish sentiment prevails then it’s highly likely that DOT/USD will surpass this resistance level soon and reach new all-time highs.


