The Arbitrum price analysis indicates that the coin has recovered after swinging low towards $1.02. The bulls have reclaimed control of the market, and the price has risen since support was established. The coin value has recovered to $1.09 at the time of writing. This upward price trend indicates bullish market sentiment, but if we look over the price action of the last few weeks, the trend line has been downward, and it seems like there is a significant likelihood of a sustained price decline in the coming week. The strong support level of $1.31 has collapsed, and now the support has gone further down to $1.02, as currently, the price is trading in the lowest price envelope.
ARB/USD 1-day price chart: Coin experiences all-time lows
Based on the one-day price analysis of Arbitrum, the crypto market is currently showing a sluggish yet optimistic trend, with buyers dominating the price movements for the day. The coin discovered an all-time low yesterday when the price tumbled to the $1.02 level. Since then, the ARB/USD exchange rate has rebounded slightly, standing at $1.02 as the market is currently trending upward.
It seems unlikely for the coin’s value to experience a significant rise as the current bullish trend does not appear to be intensifying. During the last 24 hours, the coin has experienced a downturn of 6.19 percent, while in the past week, it has undergone a substantial decline of 15.78 percent. On the other hand, the coin has gained 1.43 percent in value during the last hour.
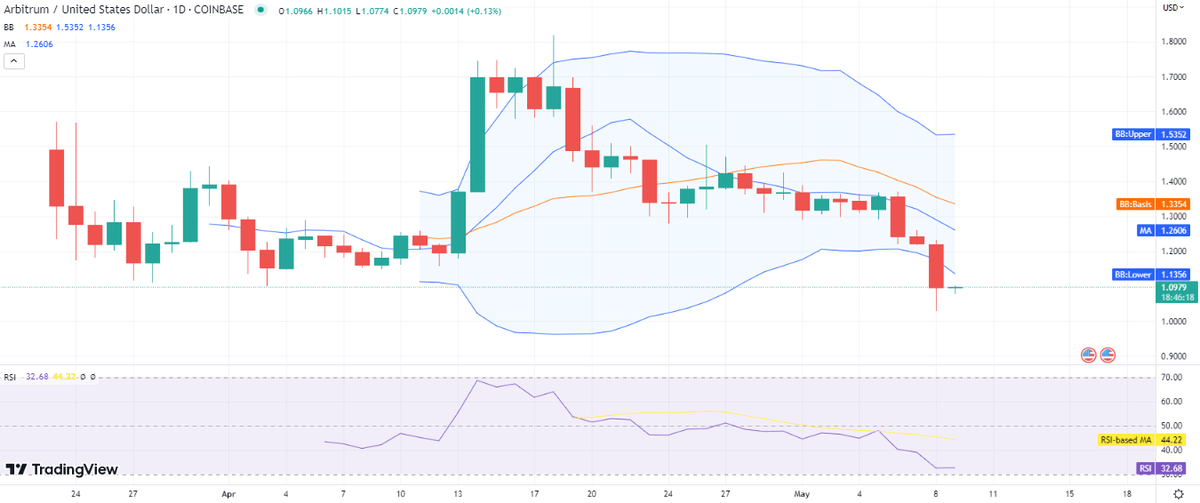
The Bollinger band located at the top is exhibiting signs of divergence, which could imply that the crypto pair may experience an upsurge in volatility in the coming future. The Bollinger bands indicator readings reveal that the $1.15 upper band serves as the most robust resistance level, while the lower band is present at $1.13 with the price trading below it. As for the Relative Strength Index (RSI) score, it has remained static due to the sluggish price oscillations, currently hovering at index 32. While the score is situated in the neutral range, it is quite near the oversold limit.
Arbitrum price analysis: Recent developments and further technical indications
Over the past few hours, the hourly Arbitrum price analysis has uncovered a bullish trend, with the cryptocurrency price displaying an upward trajectory. The coin corrected at the start of the trading session, but it has started to rebound. Currently, the crypto pair is trading at $1.09, and it is anticipated that there will be additional upward momentum in the hours to come. At present, the moving average value for the cryptocurrency is $1.14, which is lower than the SMA 50, indicating bearish suppression.
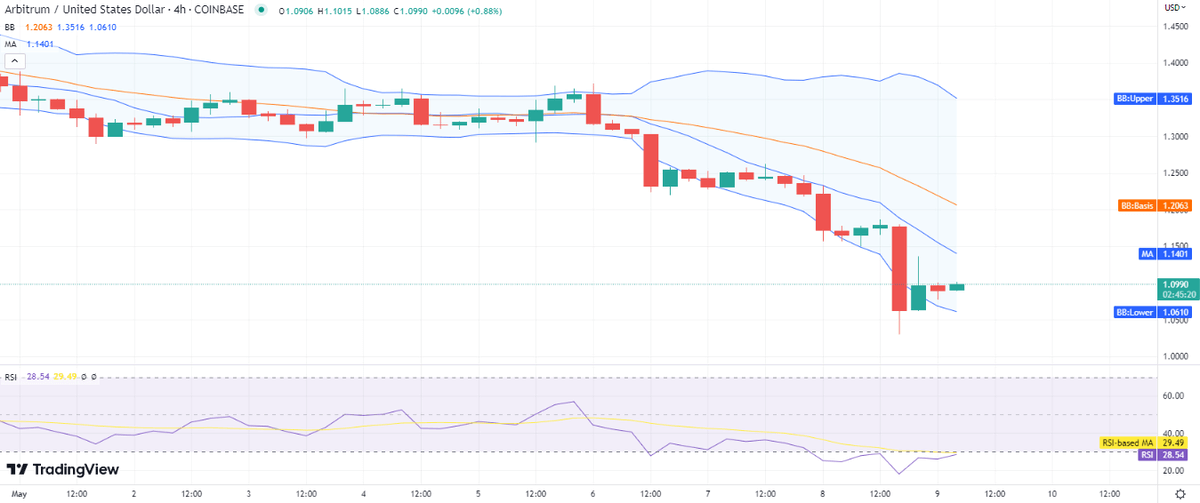
According to the Bollinger Bands indicator readings, the crypto pair is likely to experience a stable market in the hours to come. The upper Bollinger band at $1.35 represents the resistance level, while the support level is marked at $1.06 by the lower Bollinger band. The Relative Strength Index (RSI) score has been moving upwards at a slow pace at index 28, still indicating the coin is undervalued at the moment.
Arbitrum price analysis: Conclusion
Based on both hourly and daily Arbitrum price analyses, there is evidence of an ongoing increase in the value of the coin. While the market trend has been bearish at large, the coin value may suffer in the next trading session, with ARB/USD currently standing at $1.09. It is possible that the market will continue to uptrend in the hours to come, if the buyers maintain their control over the situation. Nevertheless, it should be noted that there is a possibility of selling pressure, which may result in a potential reversal of the trend towards the end of the day.