

The Avalanche price analysis is slightly on the bullish side, but the coin has been struggling around the $15 range today. The coin received some support today after being in decline since May 6, 2023, when the cryptocurrency market collapsed, although price movement has been gradual. The market is still under negative pressure, and AVAX is finding it hard to recover, so the recovery is gradual. However, the market sentiment might turn positive after a few hours as sellers might also be exhausted by now.
AVAX/USD 1-day price chart: AVAX stages a recovery after the recent market correction
The one-day Avalanche price analysis reveals that the coin has found support and is recovering today after falling for the previous four days. Because the trends have been in favor of bears for the past few days, the coin has lost 1.24 percent in the last 24 hours, and the bears have inflicted significant damage, as the cryptocurrency has lost 8.12 percent of its value in the last week, which is a bad sign for purchasers. The price has risen to $15.35. In the one-day price chart, the moving average (MA) is trading above the price level of $16.42.
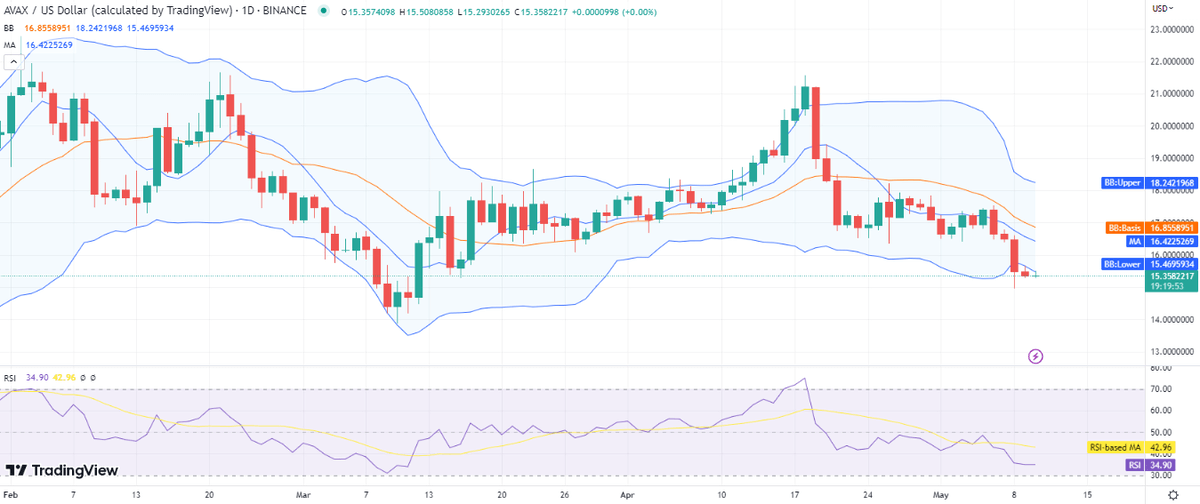
Volatility has been increasing, and the bottom arm of the volatility indicator has moved farther south; thus, a further decline is likely in the coming days. For the day, the Bollinger Bands Indicator displays the following values: The highest figure is $18.24, which represents the biggest resistance, while the lowest value is $15.46, which is also higher than the current price. Because of the rise, the Relative Strength Index (RSI) score is holding around 34, whereas it was previously on a downward trend.
Avalanche price analysis: recent developments and further technical indications
According to the 4-hour Avalanche price analysis, the price breakout was downward, and it continued to fall for the first four hours of the trading session today. However, support has appeared and bulls are attempting to retake the lead, as the coin’s price is currently rebounding and has surged to $15.36, implying that the price may continue to recover in the coming hours.
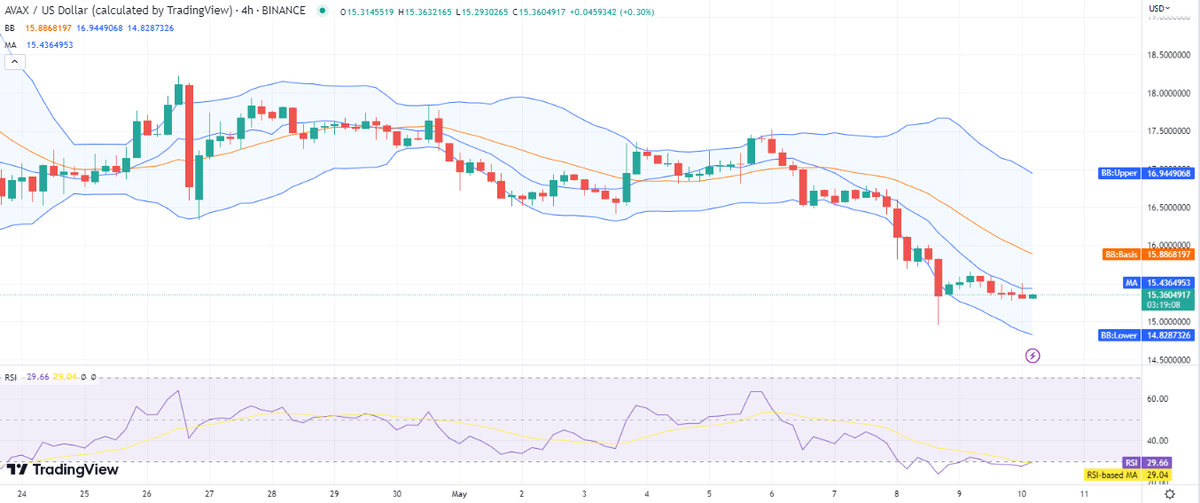
The moving average indicator is $15.43 higher than the price level. The average of the Bollinger Bands Indicator is 15.88; the higher value is $16.94 and the lower value is $14.82, indicating strong volatility. Because of the current purchasing activity, the RSI is trading in oversold territory at index 29, with an upward curve on the four-hour chart.
Avalanche price analysis conclusion
The one-day and four-hour Avalanche price analyses indicate a positive trend for the day, with the price function growing. Even though the bears produced a modest deficit in the price over the first four hours, we still predict AVAX price levels to rise further in the coming hours today.


