Today’s Bitcoin price analysis shows BTC reclaimed the 27,000 level and is trading between $26,766.10 and 27,646.35. The critical resistance for BTC lies at 28,000. A break above this level could signal a further upside. On the downside, if Bitcoin fails to remain above 27,000 support and plunge below 26,800 or even 25,200, it could turn bearish in the short term.
The bulls are controlling the market and seem to have the upper hand against sellers. Also, there appears to be a lot of buying pressure after Bitcoin broke above $27,000 on Sunday. Bitcoin’s weekly close at $26,930 has thwarted the bears’ attempt to break below the critical $26,000 support zone.
BTC/USD daily chart price analysis: BTC breaks above crucial zone
Bitcoin price analysis on the daily chart shows that the bears could not break below the $26,000 support zone. The buyers have regained control and pushed the price back up towards 27,000. However, BTC is still trading within a narrow range between 26,800–27,400. A breakout from this range could signal a further upside.
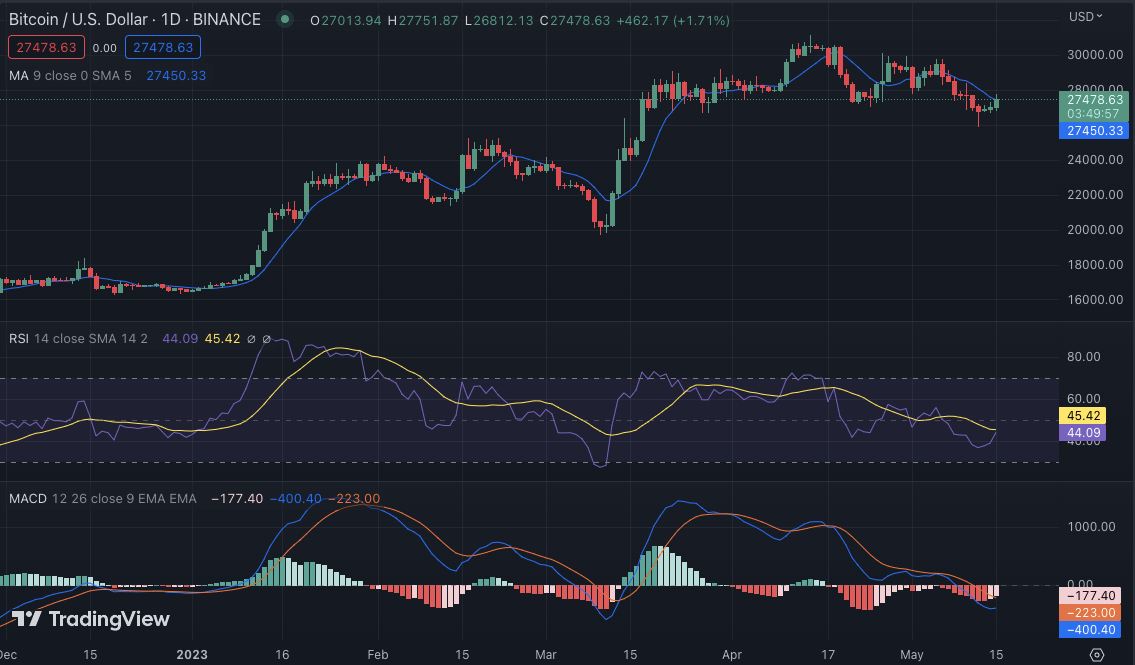
The MACD is currently in the bullish zone and shows increasing momentum for higher prices. The RSI, on the other hand, is still hovering below 50, which suggests that BTC has yet to gain enough strength for a strong upside move. If Bitcoin fails to break above $27,400, it could retrace to the $26,000 level. The Relative Strength Index RSI rose gradually and upwards, indicating that the bulls are slowly regaining strength. Bitcoin is slowly recovering from the recent dip and trading above crucial support zones.
BTC/USD technical analysis on a 4-hour chart: Bulls gain an upper hand
Bitcoin price analysis on the 4-hour chart indicates a strong buy sentiment and a continuation of the uptrend. The MACD shows increasing momentum and is currently in the bullish zone, suggesting that buyers are gaining strength. The RSI has also moved into the overbought territory, signaling that a further upside move could soon be on.

Bitcoin price analysis on the 4-hour chart reveals a bullish pennant pattern is starting to form. If the bulls break above 27,400, it could signal a further upside toward the 29,000 level in the coming days. On the downside, if Bitcoin fails to stay above 26,800 support and plunges below 25,200, it could turn bearish in the short term.
Bitcoin price analysis conclusion
Based on the current price movement, Bitcoin price analysis reveals that buyers are staging a strong comeback, and bulls have gained the upper hand against sellers. A break above 27,400 could signal a further upside toward the 29,000 level in the coming days. However, if BTC fails to remain above 26,800, it could turn bearish again and return to 25,200 or even lower support levels. Bitcoin’s market volatility is expected to continue in the coming days as traders anticipate further price action.