Aptos price analysis shows a negative trend in today’s trading. The APT/USD pair declined to the $8.17 mark after the bulls failed to push the price higher. The APT/USD pair had a high of $8.38 the previous day but the bulls could not sustain the momentum. For now, the pair is trading below its previous day’s high and is likely to remain bearish in the coming sessions. The support for APT/USD remains at $8.01, which supports the bearish trend. On the upside, the resistance is seen at $8.38 and if the bulls can break this level, then we could expect another strong rally in APT/USD.
Aptos price analysis 1-day price chart: APT /USD pair is trading in a downtrend
On the 1-day price chart, Aptos price analysis is trading in a strong bearish trend. The pair has been declining for most of the past few days in a row. The coin has lost more than 2.69 percent value during the last 24 hours and is currently trading at $8.17. The trading volume is still in a gain of 62 percent and is currently at $48 million, while the market capitalization has decreased to $1.61 billion. The daily chart for APT/USD shows strong bearish momentum in the market with two significant bearish candles forming on the price chart.
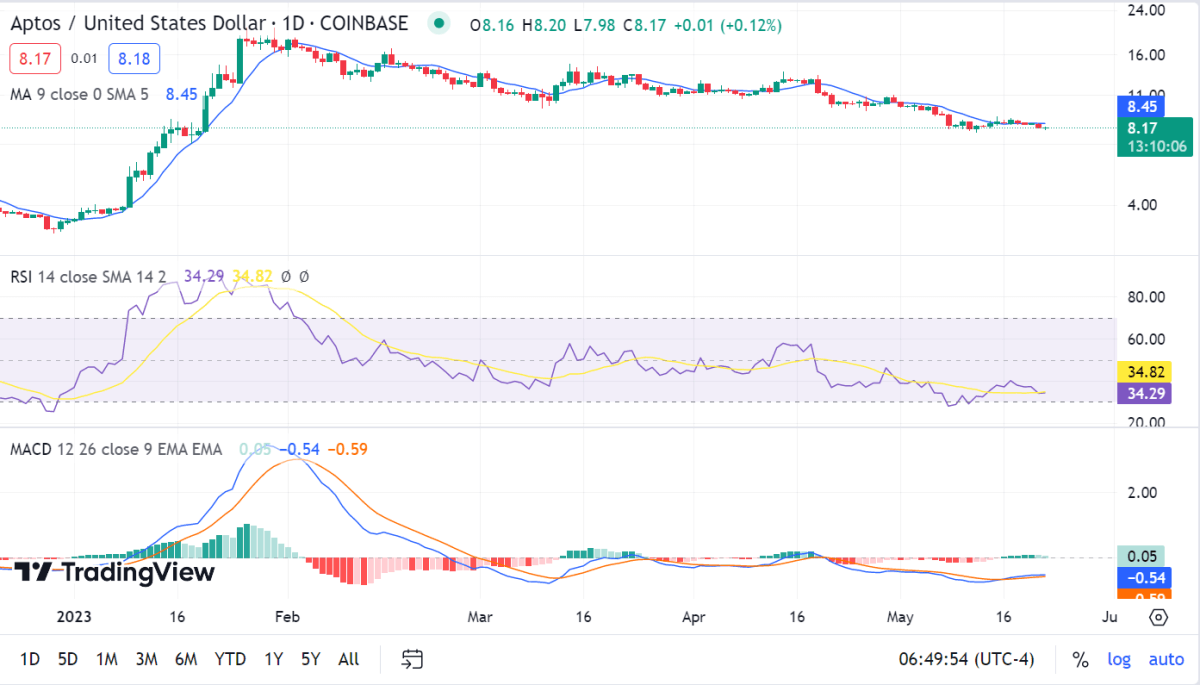
The technical indicators are also pointing towards bearish sentiments for the APT/USD pair. The moving average convergence/divergence (MACD) is trading in a bearish crossover, with the signal line moving below the MACD line. The relative strength index (RSI) is also trading in a bearish zone and has dropped below the 50 level at 34.29. The moving average is also showing a downtrend, currently, the MA on the 1-day chart is at $8.45 just near the current price of $8.17.
Aptos price analysis: Selling pressure is likely to continue
The 4-hour Aptos price analysis shows a steep deficit in the price levels as the bears have regained their strength. The price has stepped down to $8.17, which is surprising for the buyers, but the coin was under bearish pressure from the start of the day; however, most of the loss incurred during the last 4 hours when bears plunged the price levels exceedingly low.
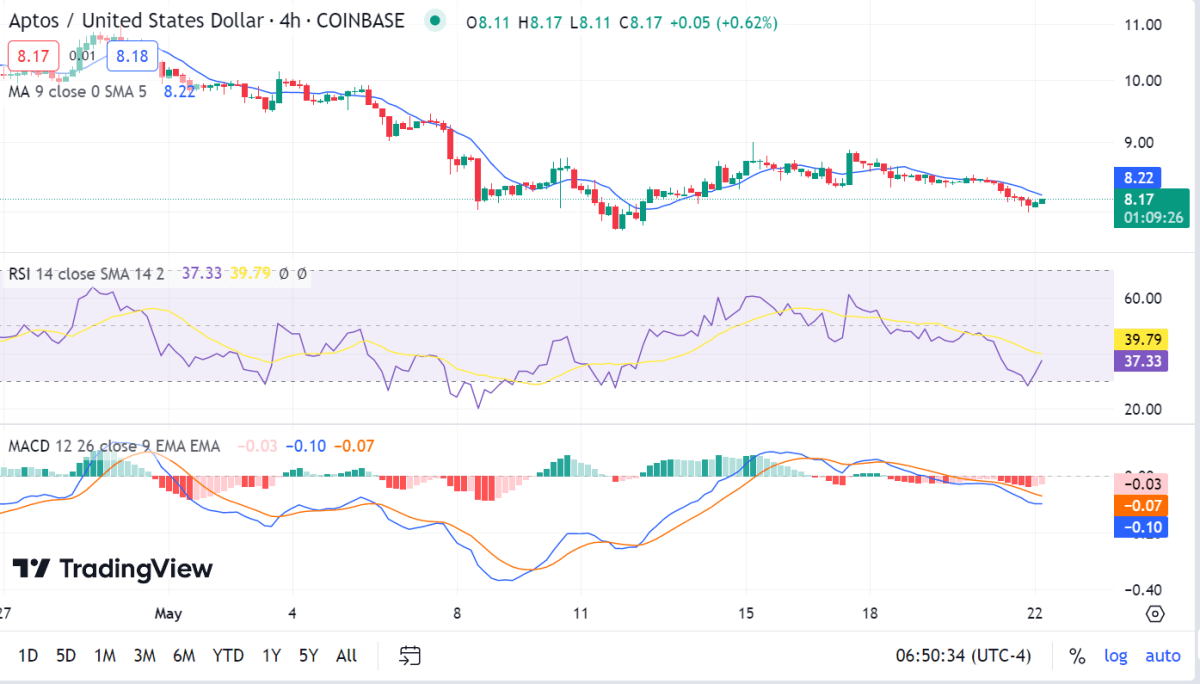
The RSI index has also decreased up to index 37.33, and the curve is still pointing downwards as the selling pressure continues to suppress the price levels. The MACD line is trading below the signal line, which is indicating a bearish trend, additionally, the histogram is also slightly slanted downwards, which supports the bearish trend for Aptos. The price has also breached the 20 and 50-day moving average levels and with this point in time; it seems that the selling pressure is likely to continue in the coming days.
Aptos price analysis conclusion
Aptos price analysis shows that the APT/USD pair is in a bearish trend and has declined below its previous day’s high at $8.38. The technical indicators are also pointing towards bearish momentum in the market, with the selling pressure likely to continue in the coming days. The APT/USD pair is currently trading at $8.17 and is likely to go lower if the bearish momentum persists. The support for APT/USD remains at $8.01, which could be a key level of resistance for the bulls.