Arbitrum price analysis reveals a bearish trend, as a steady downtrend can be observed for the past 24 hours. The Arbitrum token has broken below the $1.3355 resistance level, and it is currently trading around the $1.13 level. The ARB price has seen a sharp decline of nearly 2.05% in the past 24 hours. The support for ARB lies around $1.0396, and if it breaks below this level, the price can further decline toward the $1.00 mark, which is crucial psychological support for the Arbitrum token.
On the upper side, the bulls need to push prices back for a chance at recovery over the coming weeks. Further gains are likely if ARB breaks above the triangle formation and climbs back above $1.4 in the days ahead.
Arbitrum price analysis 1-day chart: ARB/USD declines to $1.13 following a negative trend
The 1-day Arbitrum price analysis indicates that the ARB price is bearish in the short term. The token has been trading on a sideways path for the past few days and is currently hovering around $1.13, down 2.05% from its all-time high of $0.02 set last month. The 24-hour trading volume has increased significantly in the past 24 hours, reaching $18.48 million. While the market cap is still relatively low, indicating that the ARB has not experienced much speculative activity, it is currently at $1.44 billion.
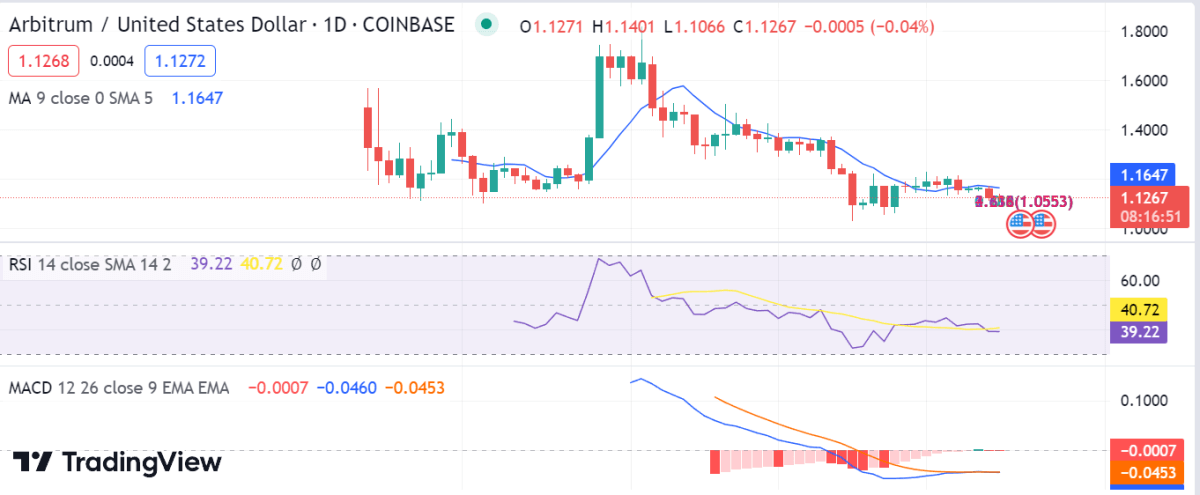
The Relative Strength Index (RSI) for Arbitrum stands at 39.22, which indicates the token is oversold and may be due for a rebound in the near future. The MA 50 and MA 200 for ARB stand at $1.1272 and $1.1268, respectively, both of which indicate that the token is in a bearish trend in the medium term. The MACD also indicates that the is currently in a strong downtrend, with histograms decreasing steadily over the past few days
ARB/USD 4-hour price chart: Latest development
The 4-hour chart for Arbitrum shows that the Bears have had the upper hand for the last few days. The ARB price has been in decline over the past few days and has broken out of its triangle pattern. From current levels, if bulls can push prices back above $1.3355, it could indicate that ARB is ready to make a recovery toward its all-time high. Investors should remain cautious and keep an eye on the price action for further clues.
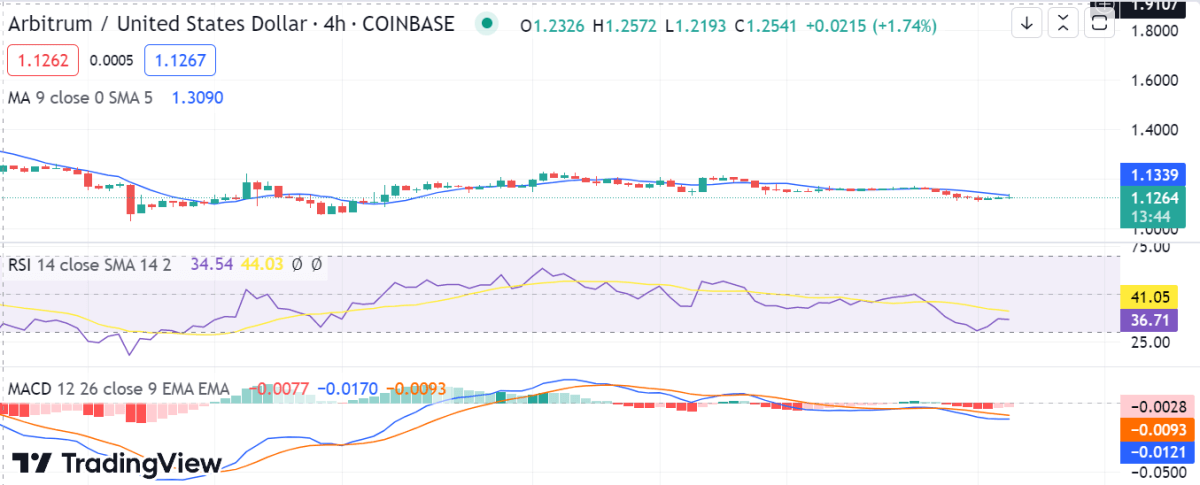
ARB/USD 4- price chart, Source: TradingView
The moving average (MA) has also been hovering at the $1.3090 level below the price. The RSI (Relative Strength Index) indicator also points towards a bearish trend as it has dropped below the 40 level, which signals that the bears are strong at this point. The MACD (Moving Average Convergence Divergence) indicator is also bearish and shows a decrease in buying pressure.
Arbitrum price analysis conclusion
Overall, the Arbitrum token looks bearish in the short term but could rebound in the near future. It is important for investors to monitor the market closely and act accordingly depending on how ARB prices react. Keep an eye on key levels of support and resistance for further clues. If the bulls can push ARB back above $1.355, then it could indicate that the token is ready to make a comeback.