
According to the AAVE price analysis, today’s outlook is bullish, with an observed price increase up to $65.4. The bulls have effectively constructed a gradual upward trend line for the price over the past few days, which continues to hold true for today. While the price briefly reached a height of $66.1 earlier in the day, it encountered strong resistance at this level, causing a retracement. Nevertheless, the coin has experienced substantial value gains and successfully surpassed the $65.3 resistance.
AAVE/USD 1-day price chart: Bullish strike launches price above $65 hurdle
The 1-day AAVE price analysis indicates that there has been a price increase observed today, with the coin currently trading at $65.4 at the time of writing. Throughout the day, AAVE has traded within the range of $63.9 to $66.1. Moreover, the AAVE/USD pair has exhibited a value increase of 2.12 percent over the past 24 hours and has generated a profit of 5.31 percent over the past week, showcasing a slightly upward overall trend. Additionally, the trading volume has risen by over four percent, while the market capitalization has experienced a 2.18 percent increase overnight.
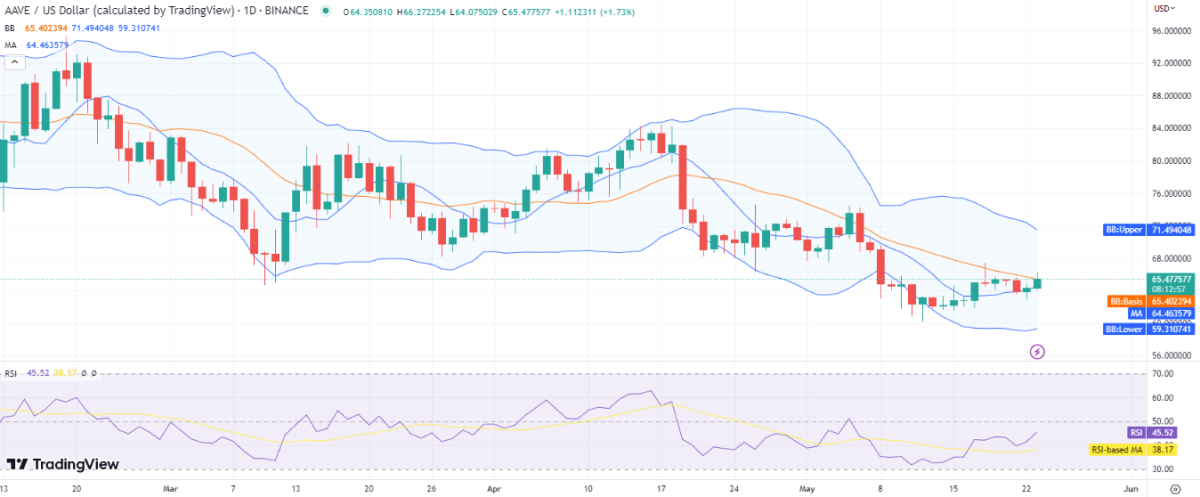
Although volatility remains high, there are indications that the Bollinger bands are gradually converging, suggesting a potential decrease in volatility in the future. The upper limit of the Bollinger bands is currently positioned at the $71 mark, serving as a resistance level that AAVE needs to overcome if the bullish momentum persists. Conversely, the lower band is situated at the $59 level, acting as a support level for AAVE. Additionally, the mean average of the indicator is located at the $65.4 mark, just below the current price level.
Yesterday, the price of AAVE moved above the moving average (MA), which is currently positioned at the $64.4 mark. This indicates a bullish signal, as it suggests a positive deviation from the average price. Furthermore, the relative strength index (RSI) is currently at index 45 and exhibiting an upward curve, indicating an increase in buying activity within the market. These factors together suggest favorable market sentiment and a potential upward movement in the price of AAVE.
Aave price analysis: Recent developments and further technical indications
Looking at the 4-hour AAVE price analysis, it is observed that the price broke out in an upward direction at the beginning of today’s session, following a bullish lead. The overall trend has been upward for a period of 36 hours, punctuated by a few bearish retracements. However, selling pressure has resurfaced, leading to a downward movement in price over the last four hours.
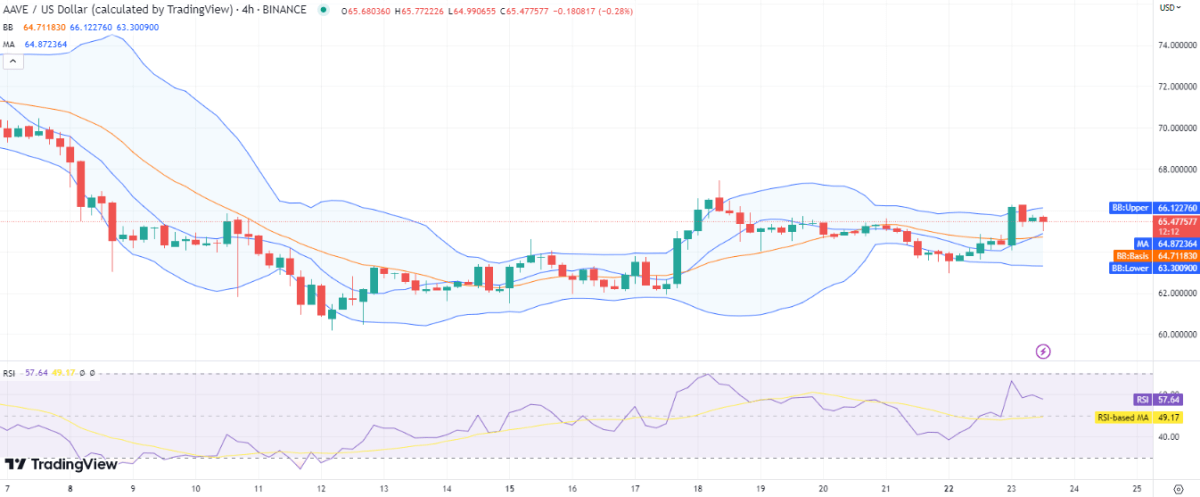
The volatility has been increasing on the 4-hour chart also as the Bollinger bands are expanding, the upper band is present at the $66 mark, representing resistance for AAVE, and the lower band is present at $63, representing support for AAVE. The MA is present at the $64.8 mark after crossing above the SMA 50 curve, and the RSI is present at index 57, but the downwards curve of the RSI is hinting at selling activity that took over the market just now after the bullish exhaustion.
Aave price analysis conclusion
The analysis of AAVE’s price reveals a substantial recovery over the past few hours, with the most notable improvement occurring today as the bulls demonstrated aggressive momentum. However, there are indications of bullish exhaustion, as suggested by the 4-hour relative strength index (RSI). Currently, the coin is undergoing a correction and is trading below the $66 level. It is anticipated that after the correction concludes later today, AAVE/USD will make another attempt to overcome the $66 resistance.


