The recent Cardano price analysis shows a bearish trend in the market as ADA breaks below $0.3600 after several days of a downtrend trading pattern. The bears have taken control of the market and have pushed prices lower. The price has declined by 1.42 percent since yesterday with a current trading price of $0.3572.
The immediate support for ADA is seen at the $0.3557 mark, while resistance is at the $0.3649 level. The support level is likely to be tested as the bears persist in pushing prices lower. If the price falls below this support, we can expect further declines and a test of the $0.3500 level. The resistance level is likely to remain strong, however, and it will take a strong bullish move for ADA prices to break above this level and key resistance points.
Both the market cap and trading volume have faced a major hit as a result of this downtrend. The 24-hour trading volume is currently $147 million showing a loss of 16.19%, and the ADA market cap stands at $12.4 billion having lost 1.40%.
Cardano price analysis daily chart: ADA seeks support at the $0.3550 mark as bears take control
The daily chart for Cardano price analysis shows a decrease in the price action over the last 24 hours. ADA is trading in a wide range between $0.3550 and $0.3649, with bulls unable to push prices higher and bears taking control of the market. Prices have failed to hold the key support level of $0.3600 as buyers remain on the sidelines amidst increasing bearish pressure.
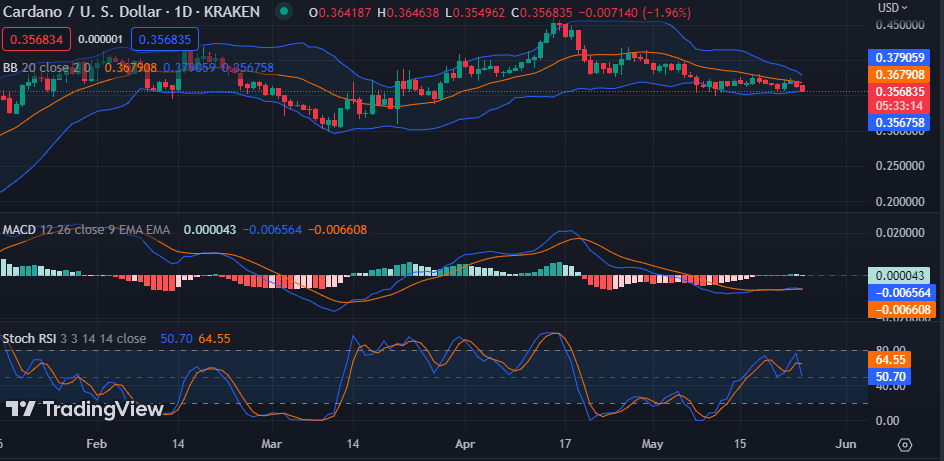
On the technical indicators front, the Stochastic RSI is moving down with a value of 50.70 which suggests that further losses are yet to come. The MACD line also confirms a bearish move as it moves below the zero line. If the selling pressure continues we expect red bars to appear in the histogram. The Bollinger band indicator shows a decrease in volatility and a narrowing of the bands.
ADA/USD analysis hourly chart: Recent developments and further developments
Cardano price analysis on the daily chart shows that the bearish pressure is still in control of the market. ADA/USD has created support at the $0.3557 mark after trading in a sideways manner the whole day. On the chart, ADA is trading heading upwards as buyers attempt to break down the psychological barrier of $0.3600 and recover some of the losses.
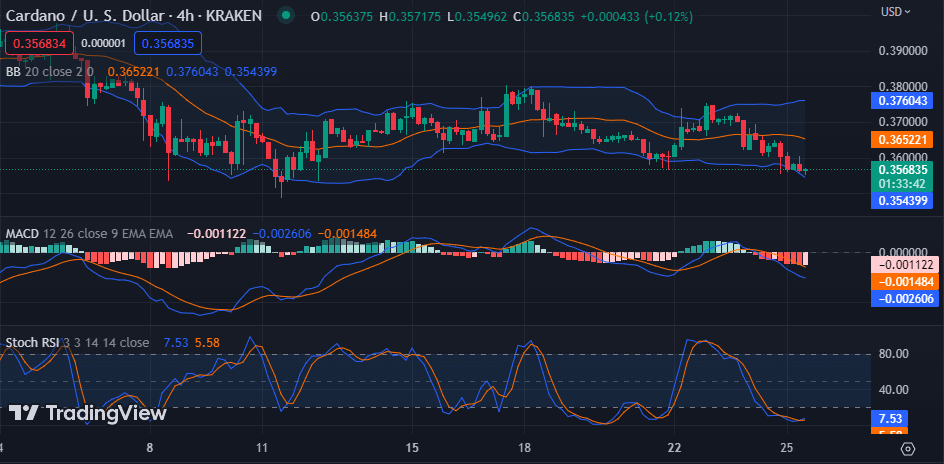
The hourly chart shows that buyers are still a few points away from breaking above $0.3600 and the Stochastic RSI is changing direction to head upwards, which suggests the buying pressure is increasing. The MACD line is below the zero line indicating a bearish move and if this continues we expect the red bars on the histogram to continue ruling. The Bollinger bands have a wide structure with the lower band sloping downwards showing that volatility is on the rise on the downside.
Cardano price analysis conclusion
Overall, Cardano price analysis shows that ADA is in a bearish trend and bears are still dominating the market. Prices have failed to maintain above $0.3600, and if sellers remain persistent prices could test the $0.3500 support level soon. The immediate support for ADA is at $0.3557, and buyers have to break through the levels of $0.3600 and $0.3649 to steer the market back toward gains as the bears persist.