Polkadot price analysis reveals a relatively upbeat approach today; the price has gained most of its lost value. In the last few days, the cost of DOT has received much positive attention and has increased to a slight degree. On May 30, 2023, the price suddenly decreased from $5.53 to $5.31. However, the price started to gain further positive momentum the same day and regained a value of as much as $5.35. On May 31, 2023, the price saw slight highs and reached an all-day high of $5.33. Moreover, the currency price of the cryptocurrency remains around $5.29.
The present trading price of Polkadot is $5.29, accompanied by a 24-hour trading volume of $225.39 million. Its market capitalization stands at $5.23 billion, contributing to a market dominance of 0.46%. Over the past 24 hours, the price of Polkadot has decreased by -2.73%. Presently, the sentiment for Polkadot’s price prediction is bearish, while the Fear & Greed Index indicates a neutral reading of 51.
The circulating supply of Polkadot is currently 987.58 million DOT out of a maximum supply of 1.00 billion DOT. The yearly supply inflation rate is presently 10.02%, resulting in the creation of 89.92 million DOT in the previous year. In terms of market capitalization, Polkadot currently holds the sixth position in the Proof-of-Stake Coins sector and the tenth position in the Layer 1 sector.
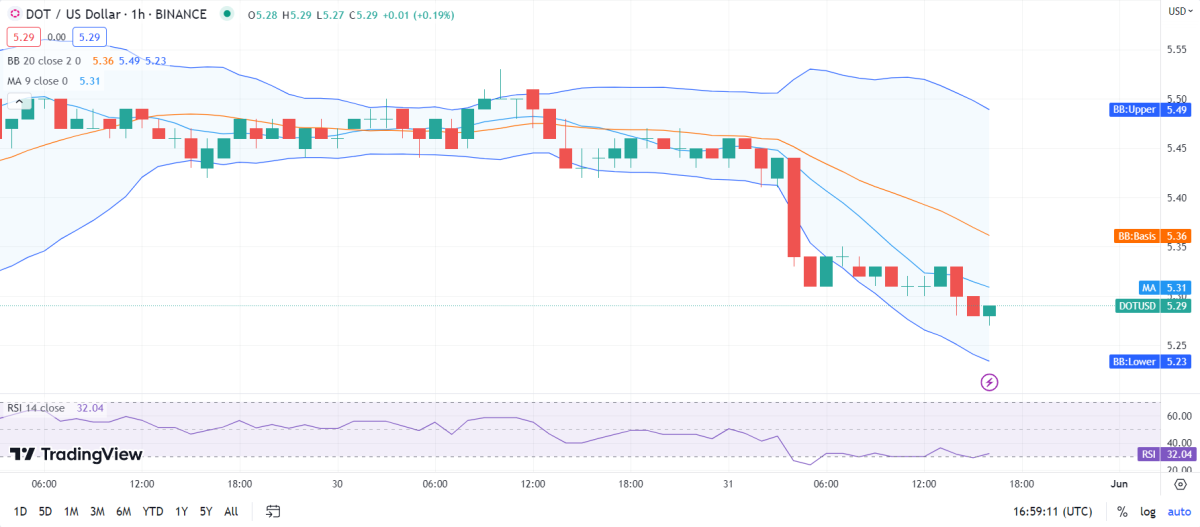
DOT/USD 1-hour price analysis: Recent updates
Based on the Polkadot price analysis, it seems that the market volatility tends to converge towards a closing movement, leading to a reduced susceptibility of DOT prices to sudden and drastic changes. Currently, the upper limit of the Bollinger’s band is positioned at $5.49, representing a significant resistance level for DOT. Conversely, the lower limit of the Bollinger’s band is situated at $5.23, acting as a robust support level for DOT.
According to the DOT/USD price chart analysis, it is observed that the price of DOT has crossed below the Moving Average (MA) curve. This crossing is generally interpreted as a bearish signal in the market, suggesting a potential downward trend for DOT. Furthermore, the price is currently attempting to break through the Moving Average band, indicating a possible reversal in the prevailing market trend.

Based on the Polkadot price analysis, the Relative Strength Index (RSI) score for DOT/USD is currently at 32, which indicates that the asset is in the undervalued region. The RSI score has shown an upward movement within this undervalued region, suggesting a potential move toward stability. This implies that buying activity in the market is dominant, leading to the DOT/USD price reaching a point of uncertainty.
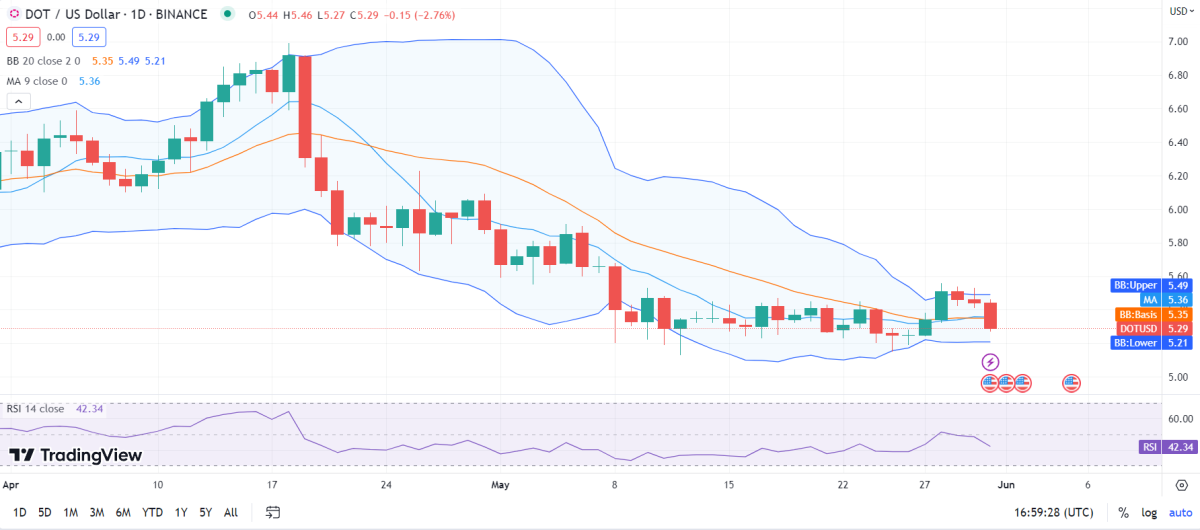
Polkadot price analysis for 1-day
Polkadot price analysis reveals the market volatility to enter a slight consistent movement; it’s beginning to squeeze as the resistance and support bands move toward each other. Based on the analysis, it is anticipated that the price of the cryptocurrency will continue to exhibit the current level of volatility and become less prone to abrupt changes. The upper limit of the Bollinger’s band, currently positioned at $5.49, is expected to serve as a significant resistance level for DOT. Conversely, the lower limit of the Bollinger’s band, situated at $5.21, is anticipated to act as a robust support level for DOT. These levels indicate key price thresholds that may influence the future movements of DOT.
Based on the Polkadot price analysis, it seems that the DOT/USD price has recently crossed over the Moving Average (MA) curve, indicating a bullish movement in the market. The price is moving upward, and there is a positive trend in the market. It appears that the bulls have gained control of the market and are likely to maintain their dominion for the next few weeks.

Based on the Polkadot price analysis, the Relative Strength Index (RSI) for Polkadot is currently at 42, which is a stable position. The RSI score is in the central-neutral region. However, it is worth noting that the RSI score is following a downward trend, which could indicate a change in the positive trend of the cryptocurrency.
Polkadot Price Analysis Conclusion
Based on the Polkadot price analysis, it appears that the cryptocurrency has significant potential for further downward movement in the market. However, at the moment, the market seems to be favoring a potential breakout, which could prove advantageous to the bulls.


