
TL;DR Breakdown
- Monero price analysis suggests sideways movement below $143.00
- The closest support level lies at $136.00
- XMR faces resistance at the $143.00 mark
The Monero price analysis shows that the XMR price action has found support at the $135.00 mark. Currently, the price action has risen to the $140.00 level and seems to be recovering further.
The broader cryptocurrency market observed a negative market sentiment over the last 24 hours as most major cryptocurrencies recorded negative price movements. Major players include BNB and ETH recording a 2.39 and a 1.09 percent decline respectively.
Monero price analysis: XMR returns to $140
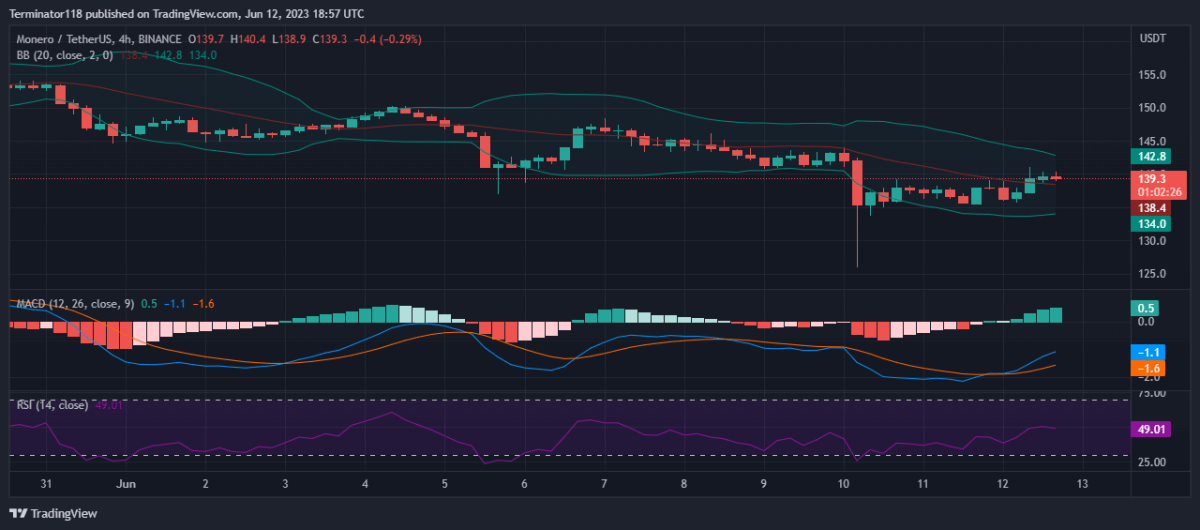
The MACD is currently bullish as expressed in the green colour of the histogram. Moreover, the indicator shows a steady bullish momentum as observed in the tall height of the histogram. Furthermore, the darker shade suggests a positive outlook as the price approaches the $140 mark.
The EMAs are trading below the mean position as net price movement over the last ten days remains strongly negative. Currently, the EMAs are trading far from each other showing strong bullish momentum at press time. Moreover, the diverging EMAs suggest a slowly increasing bullish momentum.
The RSI dipped into the oversold region yesterday as selling pressure escalated in the morning causing a steep price drop to the $128.0 mark. At press time, the indicator trades close to the oversold line at the 35.38 index level as the price suggests strong bearish dominance with the upwards slope suggesting an increasing bullish pressure at the current price level.
The Bollinger Bands are currently wide as the price action observes high volatility across the short-term charts. However, as the price moves back toward the $140.00 mark, the bands will continue converging. At press time, the bands’ lower limit provides support at the $134.0 mark while the upper limit presents a resistance level at the $142.8 mark.
Technical analyses for XMR/USDT
Overall, the 4-hour Monero price analysis issues a strong sell signal at press time with 15 indicators supporting the bears. On the other hand, only two of the indicators support the bulls showing little to no bullish presence. At the same time, nine indicators sit on the fence and support neither side of the market.
The 24-hour Monero price analysis also shares this sentiment and issues a sell signal with 15 indicators supporting the bears against only one supporting the bulls. The analysis shows bearish dominance across the mid-term charts with a low bullish presence at the current price level. Meanwhile, the remaining nine indicators remain neutral and do not issue any signals at press time.
What to expect from Monero price analysis?
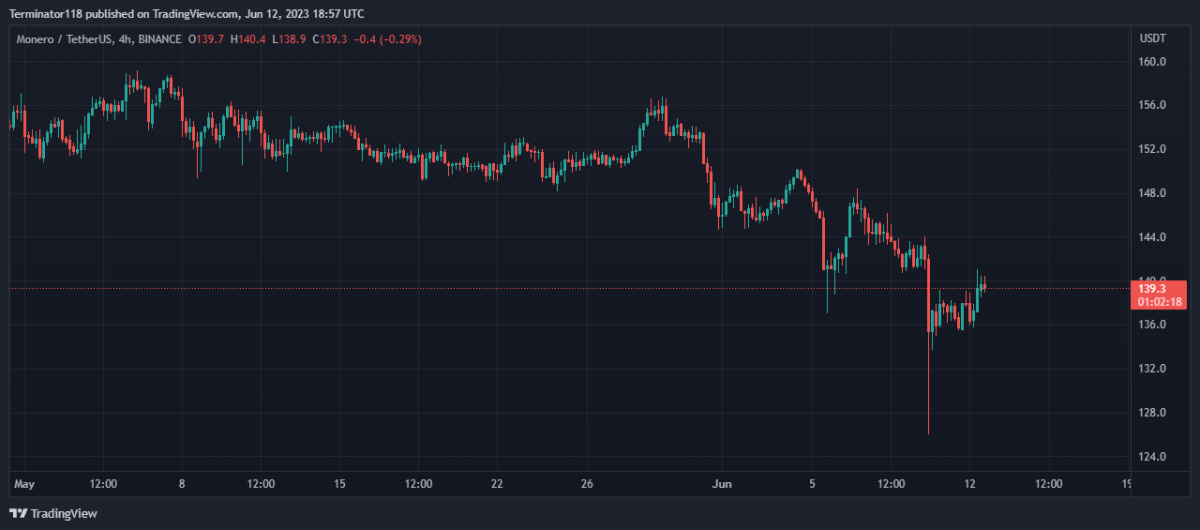
The Monero price analysis shows that the Monero market is currently in a bearish rally as the price action observed a breakdown from the $164.00 mark to the $128.00 price level. However, the bulls made some recovery and the price has risen back to the $140.0 mark.
Traders should expect XMR to continue its sideways movement as the price action struggles to find momentum between the emerging bulls and the dominant bears. The struggle is reflected in the technical analyses that show bullish across the short-term charts but bearish across the mid-term analyses. As such, the price can be expected to trade below the $143.00 mark but price movement below the $136.00 mark is unlikely given the bullish market sentiment.


