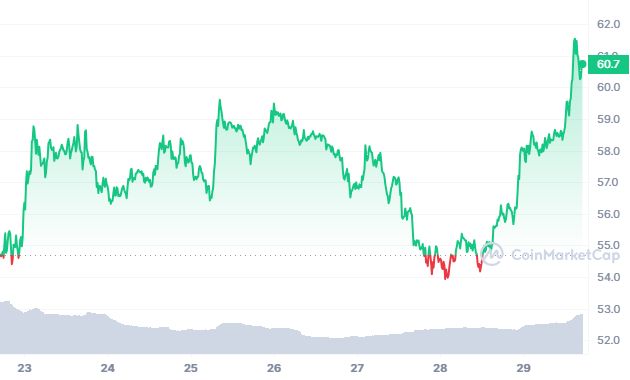
Solana (SOL), one of the leading cryptocurrencies, has witnessed a significant surge in its price, outperforming popular digital assets like Bitcoin and Ethereum. The cryptocurrency recently found support near the $93.50 level after a downside correction and has since formed a base for a fresh upward move. Today, SOL is trading over 10% higher, breaking through several key resistance levels.
Breaking resistance and technical analysis
Solana’s recent price action has been characterized by a strong upward momentum. The cryptocurrency managed to break above the $100 resistance level, which is considered a significant milestone.
This move was supported by technical analysis, including the breach of the 50% Fibonacci retracement level of the previous downward move from a swing high of $126.13 to the low of $93.50.
Moreover, a crucial development took place on the 4-hour chart of the SOL/USD trading pair, where a key contracting triangle was successfully broken. The triangle had resistance near the $104 mark, and SOL managed to overcome it.
Currently, SOL is trading above $105 and is comfortably positioned above the 100 simple moving average (4 hours).
Immediate resistance and upside potential
With SOL’s recent surge, traders and investors are closely monitoring the cryptocurrency’s potential to sustain and extend its gains. In the short term, immediate resistance is expected near the $114 level. However, the first major resistance lies around $118, which corresponds to the 76.4% Fibonacci retracement level of the previous downward move from $126.13 to $93.50.
The primary resistance level to watch is around $125. A successful close above this level could pave the way for another major rally in SOL’s price. Should the bullish momentum persist, the next significant resistance is anticipated around $138, with further potential gains taking SOL toward the $145 level.
Potential downside correction and support levels
As with any volatile asset, there is the possibility of a downside correction if SOL fails to maintain its current upward trajectory. In such a scenario, the initial support on the downside can be expected near the $108 level. This level has historical significance in Solana’s price movements and could serve as a crucial support point.
Further down, the $100 level and the 100 simple moving average (4 hours) represent essential support levels. A breach below these levels could expose SOL to further downside pressure, potentially leading to a test of the $94 support. A close below $94 might result in a decline toward the $80 support level in the near term.


