Bitcoin: The percent drawdown of the bitcoin price from the previous all-time high.

Chart source.
BTC_Supply on Exchanges (Native Units)

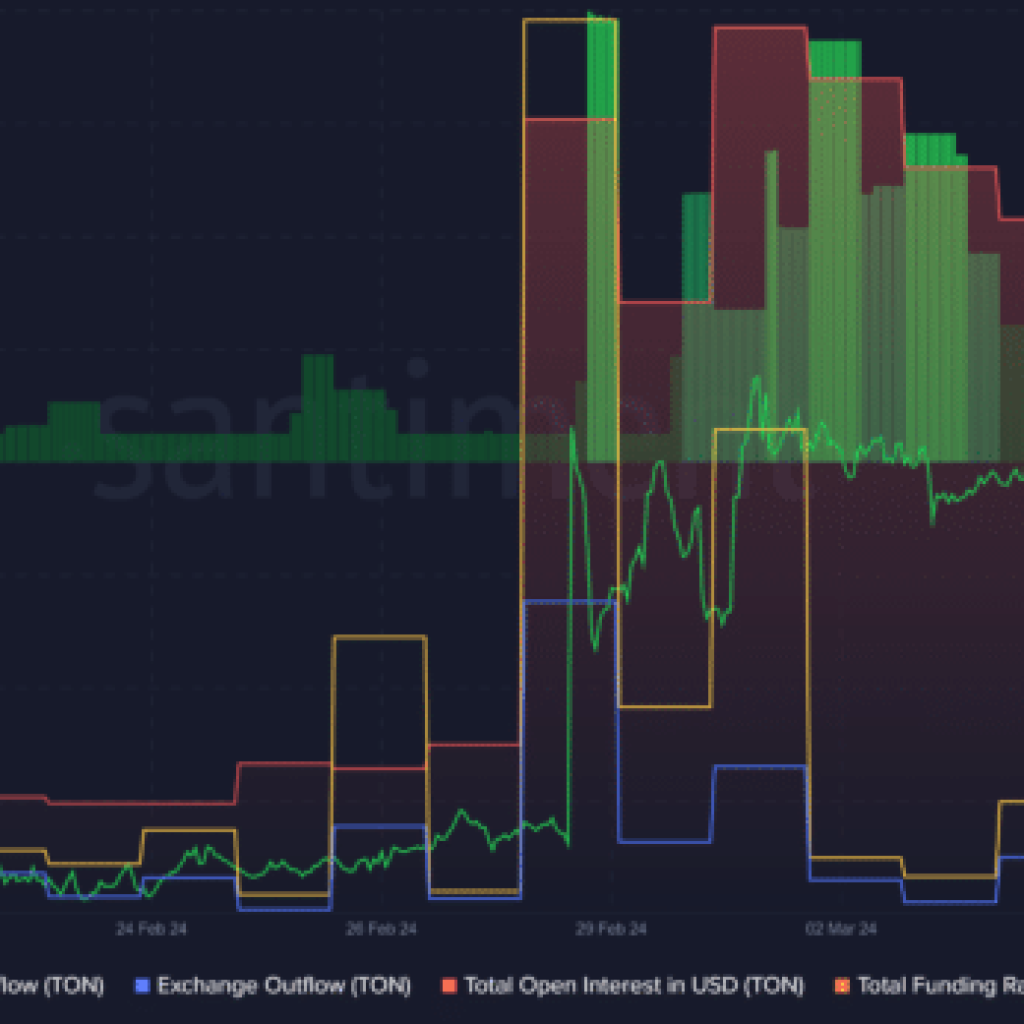
Chart source.
Weekly Crypto Asset Flows (US $m)

Chart source.
Bitcoin: MVRV Z-score (Market Value to Realised Value Ratio)

Chart source.
Bitcoin: Wave Trend Oscillator indicator

Chart source.
Bitcoin: Net Unrealized Profit/Loss (NUPL)

Chart source.
Bitcoin: Realized Cap – UTXO Age Bands USD

Chart source.
Bitcoin: Spent Output Profit Ratio (SOPR)

Chart source.
Bitcoin: Miners’ Position Index (MPI)

Chart source.
Bitcoin: The Puell Multiple (The Puell Multiple is calculated by dividing the daily issuance value of bitcoins (in USD) by the 365-day moving average of daily issuance value.)

Chart source.
Bitcoin: Hash Ribbons Indicator (The Bitcoin Hash Ribbon indicator tries to identify periods where Bitcoin miners are in distress and may be capitulating. The assumption is that such periods can occur when the price of $BTC is at major lows and may therefore present a good opportunity to buy the dip.)

Chart source.