The Polkadot price analysis reveals DOT/USD has recovered fine during the last two days after going through a steep decline. During the last two days, bulls enhanced the coin value significantly, bringing it up to $6.77 from the $6.1 level. The bullish momentum has benefited the buyers to a good extent as the coin value has improved with a notable rise in price value. Bulls toppled the resistance present at $6.43 yesterday, and today they are aiming for $6.85 resistance as their next target, as further improvement is also expected.
DOT/USD 1-day price chart: Bulls to face resistance at $6.85
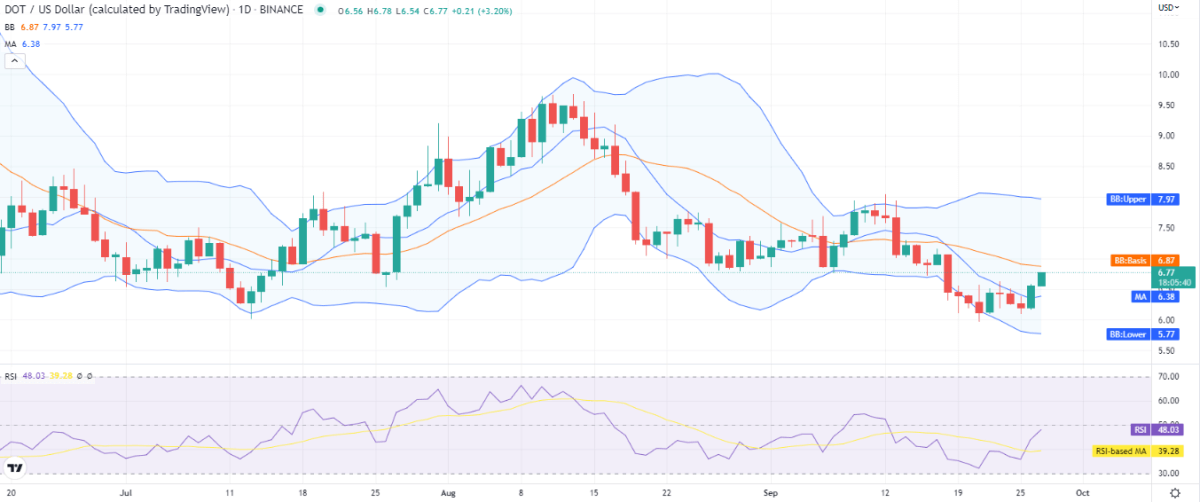
The 1-day price chart for Polkadot price analysis shows the cryptocurrency price has been advancing unboundedly since yesterday, which is a moment of encouragement for the buyers. The price has been elevated up to $6.77 in the last 24 hours, gaining more than eight percent value, as the bulls have been maintaining their upper position proficiently. The price has been able to go above the moving average (MA) value as well, which is going at the $6.38 level for the one-day price chart.

The volatility has been increasing, with the upper value of the Bollinger bands at $7.97 representing the resistance and the lower band at the $5.77 mark representing the strongest support. At the same time, the Bollinger bands average forms at the $6.87 mark above the price level. The Relative Strength Index (RSI) score has reached near the border of the oversold center line of the neutral zone at index 48, with its upward curve indicating the solid buying activity in the market.
Polkadot price analysis: Recent developments and further technical indications
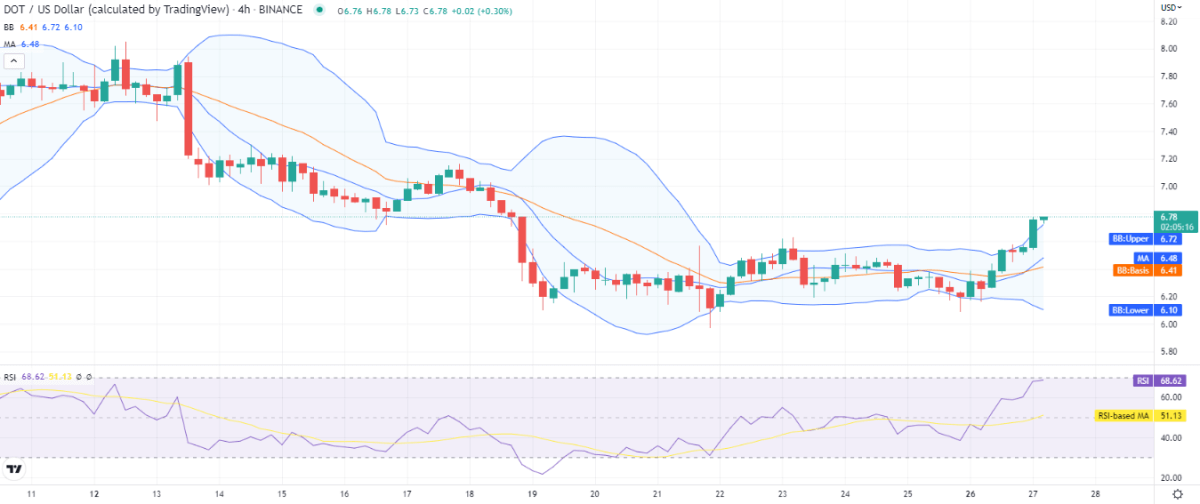
The four-hour Polkadot price analysis is showing signs of an upswing as the price has increased remarkably during the day. The bullish momentum has been intensifying over the past few hours again, and the price has been progressing upwards till the last hour. Currently, it is present at the $6.77 mark. The moving average has moved above the SMA 50 curve and has reached $6.48, which is a further bullish indication.

The Bollinger bands indicator in the four hours price chart maintains the average value of $6.41. Whereas its upper value has reached the $6.72 limit and its lower value is at the $6.10 position, the indicator shows increasing volatility for DOT. The RSI score is increasing again as the price is going up again due to the recent bullish activity in the market. The RSI indicator shows a reading of 6.72 near the overbought range on the 4-hour chart.
Polkadot price analysis conclusion
The Polkadot price analysis shows bulls are taking the price up again and have rallied high today towards $6.77. We expect DOT/USD to continue upside towards $6.85 today. However, a correction may also start as the price is nearing the last peak point.
Disclaimer. The information provided is not trading advice. Cryptopolitan.com holds no liability for any investments made based on the information provided on this page. We strongly recommend independent research and/or consultation with a qualified professional before making any investment decisions.


