It is quite a bearish day for Ethereum price analysis today as its price has gone lower by 2.04 percent. It has now been two days since a negative sentiment has been brewing in the market. Apparently, a further dip is imminent, and Ethereum might test the recent support line at $1150.

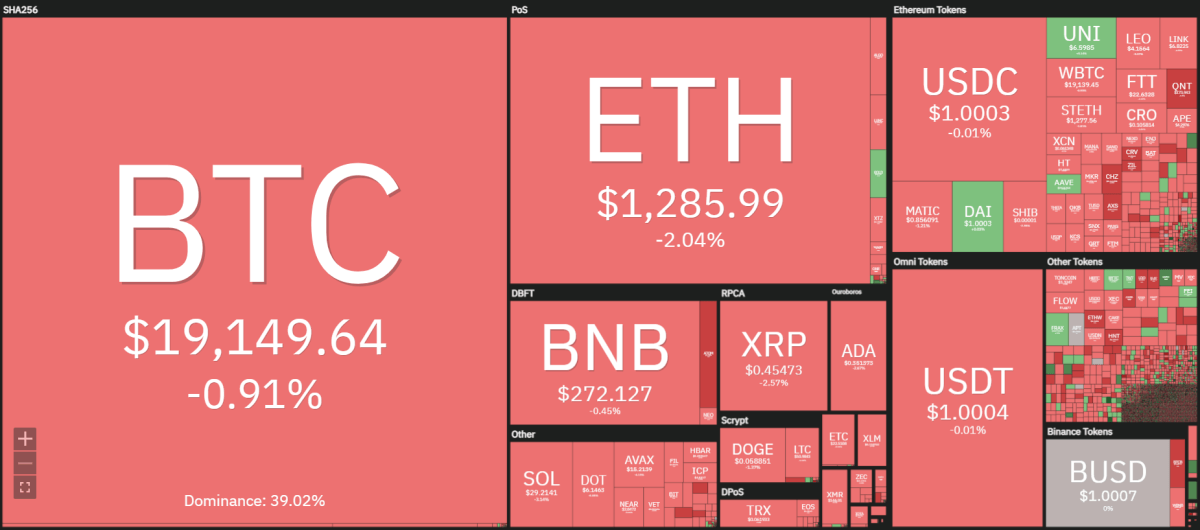
As the crypto heat map shows, Bitcoin has reduced by 0.91 percent. Other altcoins are also following the same market sentiment. The bears currently have a stronger hold on the market. This might be a good time for investors to DCA their position in Ethereum for the long-term.

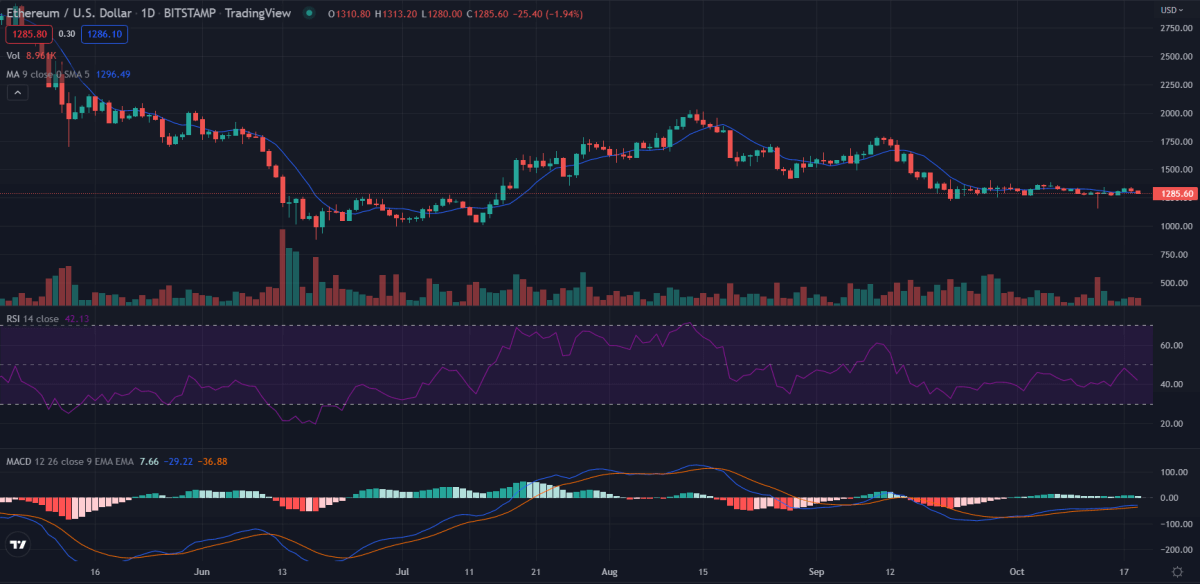
As the daily graph shows, Ethereum set strong support around the $1150 mark on the 13th of October, 2022. Since then, it has retraced back up. However, the sentiment of the market is not positive at all. While Ethereum is mostly trading in a range, the bears are gearing to push the price lower. This could lead to Ethereum retesting the $1150 support line.
Ethereum 24-hour price movement

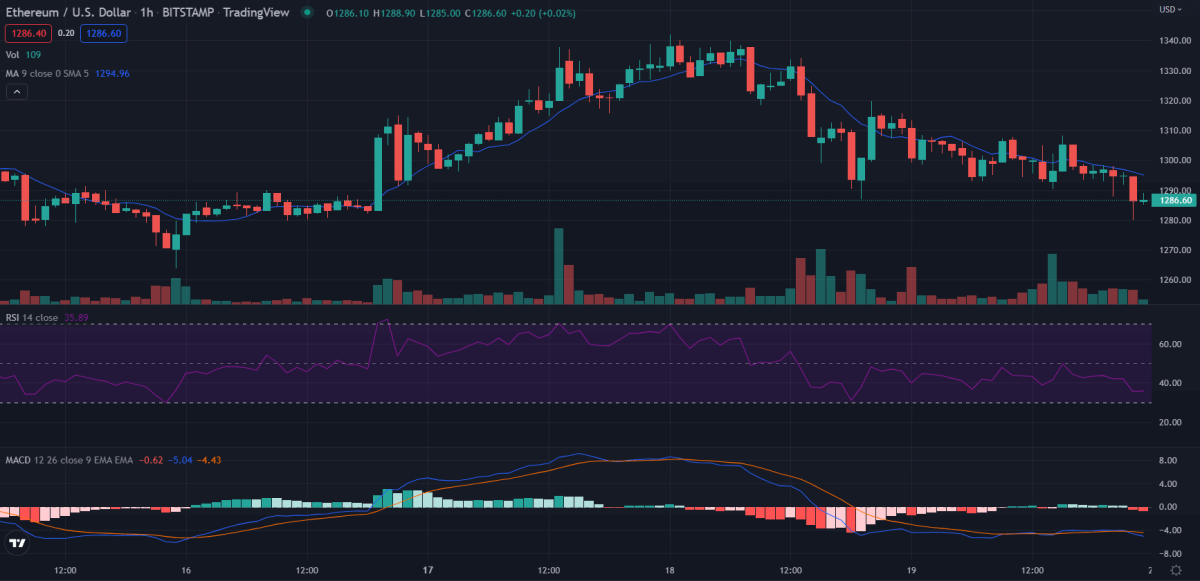
Ethereum price analysis on the 1-hour chart shows that the price closed at $1300 yesterday. However, it then dipped to a low of $1280 in the last 24 hours before retracing back to the current price of $1286.
Other than that, Ethereum also achieved a 24-hour high of $1380. So, the price has been quite volatile lately. Nevertheless, both the RSI and MACD give negative indications for their price movement in the next few hours. For instance, the MACD shows histograms in the reds with increasing intensity.
At the same time, the RSI is somewhat stable but is leaning toward the oversold side. So, there is still some room for Ethereum to go on the downside.
Overall, Ethereum’s market cap has reduced by 2.12 percent over the last 24 hours. At the same time, its trading volume has also decreased by 19.89 percent.
Ethereum price analysis 4-hour chart: ETH/USD is gearing up for the further downside

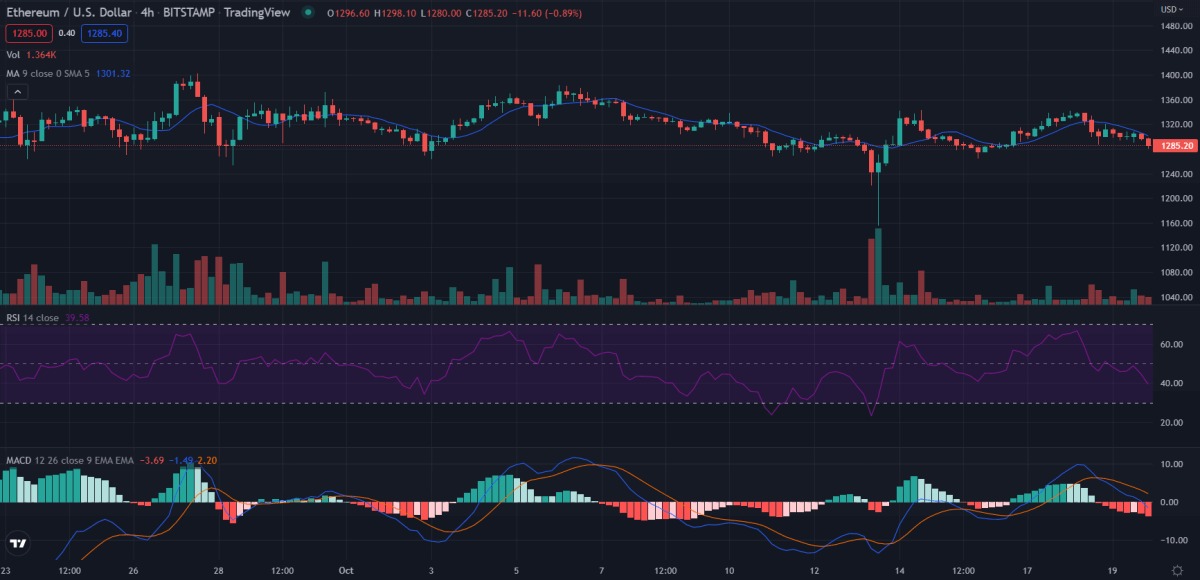
The 4-hour Ethereum price analysis chart also gives equally negative sentiments. The MACD histograms continue to fall in strength, with the RSI having a negative gradient as well. The 4-hour chart also shows Ethereum trading in the range with recent local support set around $1150. It is highly likely that in the coming few days, Ethereum will try to test the $1150 support again and might possibly break it.
Ethereum price analysis: Conclusion
The market’s sentiments are obvious. There is not much uncertainty, and Ethereum seems to be headed for the downside. So, this is not a good time for day traders to open new positions for any short-term gains.
However, long-term investors who believe in the future applications of Ethereum, such as in the Web 3.0 domain, should DCA in Ethereum. However, investors should keep in mind that it would be a long-term hold and that cryptocurrency, by its nature, is quite volatile.
Disclaimer. The information provided is not trading advice. Cryptopolitan.com holds no liability for any investments made based on the information provided on this page. We strongly recommend independent research and/or consultation with a qualified professional before making any investment decisions.


