Tezos price analysis is bullish for today, as an increase in price up to $1.43 has been observed. The bulls have been successful in crafting an upwards trend line for the price function during the last few days, and the trend is the same for today as well. Although the price touched the $1.43 height earlier yesterday, due to the strong resistance present at this level, the price function reverted back. Still, the crypto pair has managed to continue moving in a positive direction. However, the next resistance is present at the $1.43 level for the bulls to encounter.
Most of the Cryptocurrency market has been showing a positive trend lately, and XTZ is no different. The current CoinMarketCap ranking is #42, with a live market cap of $ 1,289,939,983 USD. It has a circulating supply of 913,890,268 XTZ coins, and the max. supply is not available, and a 24-hour volume of $34,677,745 USD.
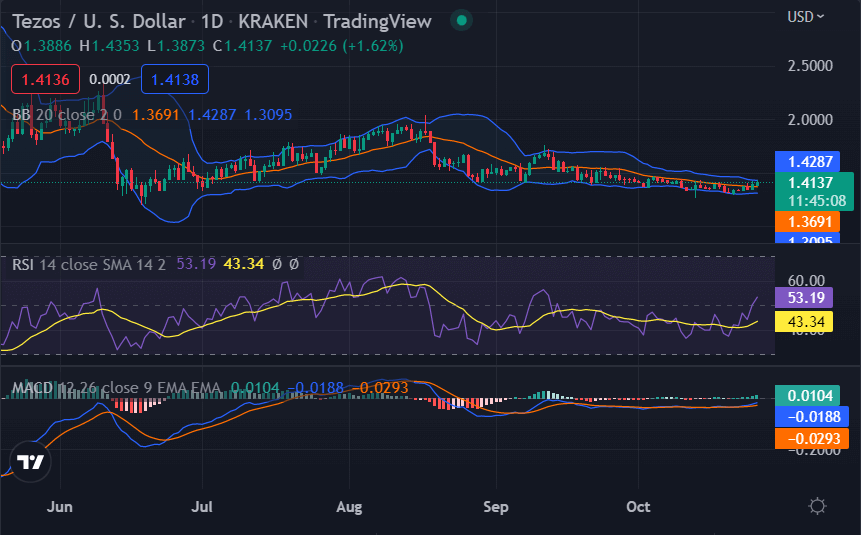
XTZ/USD 1-day price chart: Bulls successfully take the lead back after a correction
The 1-day Tezos price analysis shows an increase in price for today, and the coin is trading at $1.43 at the time of writing. The coin reports a profit of 5.43 percent over the last 24-hours as the overall trend has been steeply upwards. The weekly Tezos price analysis shows an increase in value of 14.47 percent as compared to last week’s trading value. The coin is yet to encounter strong resistance that could potentially impede its progress toward the bullish trend.

The technical indicators on the daily chart are, however, giving strong bullish signals. The RSI for XTZ/USD is currently just below the 60 levels, with a flat structure. The Bollinger bands are closing in on each other, which indicates low volatility in the market. The MACD line is above the signal line, and both lines have a positive slope, indicating a bullish crossover.
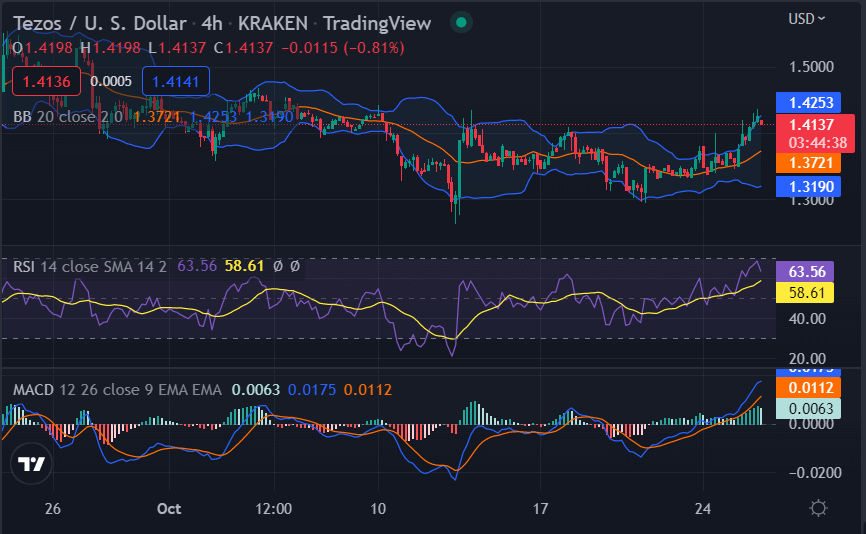
Tezos price analysis 4-hour price chart: Ascending triangle breakout
The 4-hour Tezos price analysis shows that the price breakout was upwards at the start of today’s session following the bullish lead. Overall the trend remained upward for 24 hours continuously after the correction. The price has been recorded covering a range downwards during the last four hours as well; even the bulls seem to be gaining strength.

The volatility has been increasing on the 4-hour chart also as the Bollinger bands are expanded, and the indicator has taken an upwards breakout which is a bullish indication for the future. The upper band is present at the $1.43 mark, representing resistance for XTZ, and the lower band is present at $1.35 representing support for XTZ. The RSI is present at index 68, just near the border of the overbought limit, and the upwards curve of the RSI hints at the increase in buying activity.
Tezos price analysis conclusion
Overall, the Tezos price analysis suggests a bullish trend for today, as the price is repeatedly moving upwards with strong support and buying activity. However, the bullish continues to encounter resistance at the $1.43 level, and it remains to be seen if the bulls can break through this hurdle.
Disclaimer. The information provided is not trading advice. Cryptopolitan.com holds no liability for any investments made based on the information provided on this page. We strongly recommend independent research and/or consultation with a qualified professional before making any investment decisions.


