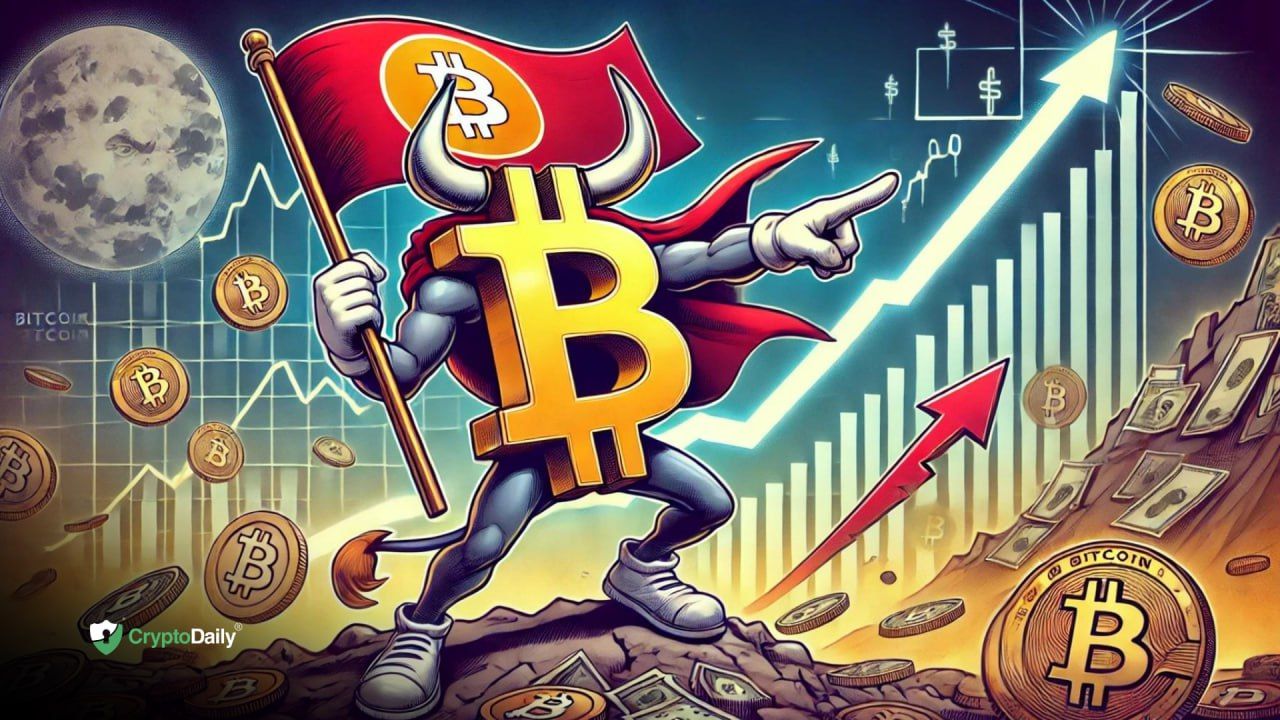
On Sunday, Bitcoin was able to hold and confirm above its bull flag with an incredible doji candle. Monday is seeing Bitcoin shooting upwards, with $71,000 in its sights. The all-time high at $73,800 should follow, before catapulting into price discovery, and the next major target of $100,000.
Game theory
The world is finally waking up to Bitcoin. Presidential hopeful Donald Trump wants to make Bitcoin part of the US strategic reserve, China is looking at unbanning it, and at least one sovereign State is possibly buying it in secret.
Could full-scale game theory be about to kick in? It will only take one of the super powers, or even one large country to start buying Bitcoin, and this could trigger a mass land grab in order to purchase what is left of a fast-disappearing asset.
For the likes of the US or China, printing up a whole load of paper and buying the hardest asset on the planet would be the simplest thing to do. Just as with gold, becoming the world’s largest holder of Bitcoin will be crucially important, as the melting ice cube of fiat currencies really starts to deteriorate, and the race to worthlessness speeds up.
Bull flag breakout
Source: TradingView
On the weekly time frame, the Bitcoin bull flag is a thing of beauty. Three perfect touch points to the bottom of the flag, and several at the top, there can be no doubt that a classic flag pattern has played out.
Last week’s candle was the key to this breakout. After reaching the top of the flag with a massive push up from the bottom over a two to three week period, a correction back into the flag nearly got down to the major support at $63,000. This was the last action within the flag, as this correction was bought up heavily by the bulls.
The week ended with a long-tailed doji candle holding support just above the top of the bull flag. Now, on Monday, the $BTC price is looking to power up and through the all-time high, before heading to its next destination.
Looking at the bottom of the chart, one can see the stochastic RSI. This is an incredibly strong momentum indicator, which is signalling that powerful momentum is currently buoying the price higher.
Bitcoin stars are aligning
Source: TradingView
Zooming further out, one can see that the price is now pushing above the high of the last bull market in 2021. Once confirmed above this level, it really will be onwards and upwards for Bitcoin.
Looking at the bottom of this chart, the RSI, which indicates overbought or oversold conditions, looks to be breaking the downward trend that began in early March this year. If this break is confirmed at the end of this week, and the indicator line is then able to get above the 70 level, a new upward trend would be confirmed.
The stars really are aligning for Bitcoin. Who would have thought, right at the beginning of this bull market, that a US Bitcoin ETF would have been granted, and that the biggest asset management company in the world, in Blackrock, would amass such a huge amount of $BTC in such a short amount of time.
Who would have thought that the biggest world governments would start to become so much more favourable towards this asset. Bitcoin’s time has come, and upside price targets are likely to become more and more difficult to predict.
Disclaimer: This article is provided for informational purposes only. It is not offered or intended to be used as legal, tax, investment, financial, or other advice.