Bitcoin’s wild ride isn’t over yet, and September might just be the month when things really start heating up. With all the excitement around the Federal Reserve potentially cutting interest rates, we’re in for some serious market moves.
First off, the big news is that U.S. money market funds have hit a record high, clocking in at over $6.2 trillion. This surge is mainly due to investors betting big on the slashing rates.
According to the Kobeissi Letter, institutional investors are getting ready, positioning their portfolios to capitalize on this expected rate cut. “The era of high rates is coming to an end,” they said.

Sounds like they’re pretty confident, and who can blame them? All eyes are now on the Fed’s meeting scheduled for September 18, where the betting odds suggest a 65.5% chance for a 25 basis-point cut and a 34.5% chance for a more aggressive 50 basis-point cut.
So, what does this mean for Bitcoin? Simple: big moves. If the Fed does go ahead and cut rates, Bitcoin could be on track to smash past $68,000. Analyst Titan of Crypto said: “Bitcoin heading toward $68,000 target. BTC’s 18% surge is in progress.”
Bitcoin’s mining difficulty is set for a slight uptick in the next few days. What does that mean? Miners are still pushing hard, which usually signals healthy network activity.
And sentiment? It’s back to neutral. That’s right, folks are neither too hot nor too cold. Kind of like that moment when your bathwater is just right, but you know it won’t last.
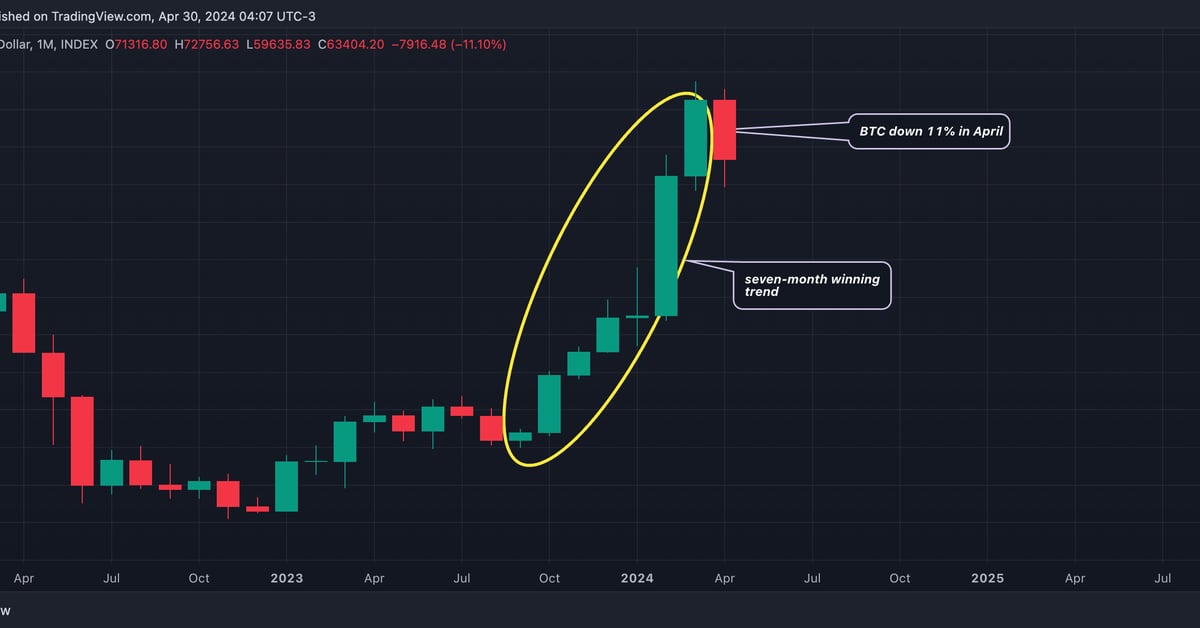
And while Bitcoin has managed to claw back after a tough start to August, everyone’s fixated on that elusive monthly close. Even though it is up around 40% from this month’s lows, it’s still got a lot on its plate.
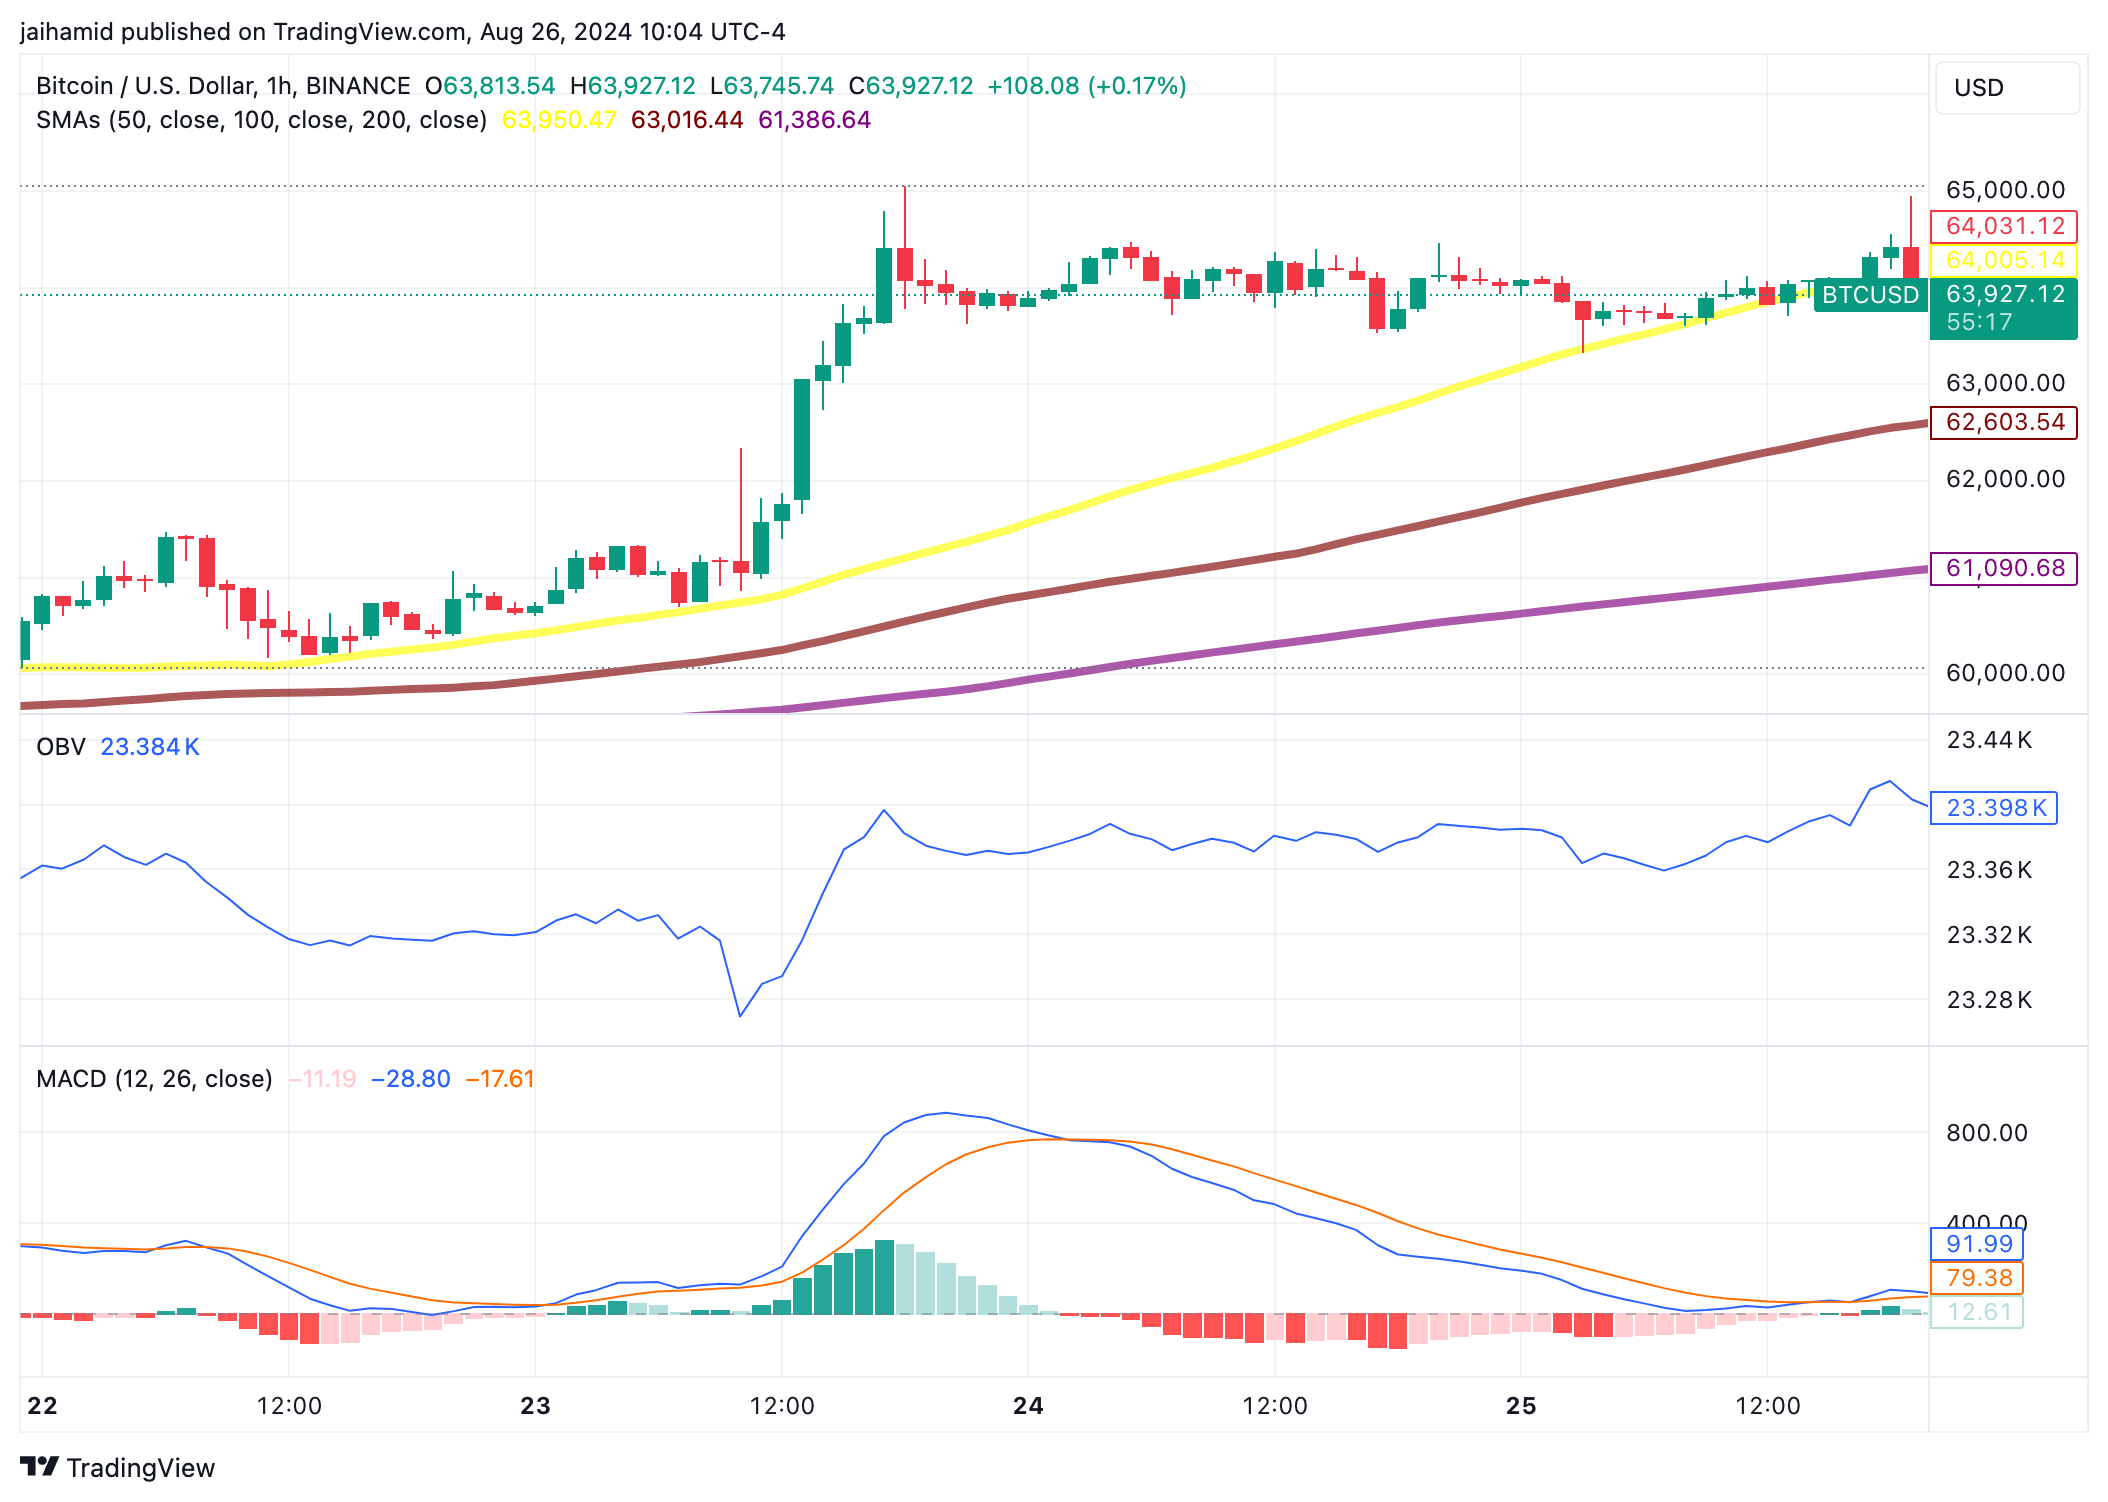
The price range at press time was a tight squeeze between $63,813.54 and $63,927.12. This suggests a bit of consolidation.
Bitcoin’s price is sitting just above the 50-period SMA ($63,950.27), which signals short-term bullish vibes. The fact that it’s also above the 100 ($63,016.34) and 200-period ($61,386.59) SMAs means the bulls aren’t ready to throw in the towel yet.
If the price stays above these levels, September could see some fireworks. But if it drops below, we might be in for a bit of pain.

Then there’s the On-Balance Volume (OBV) indicator, currently at 23.398K. This bad boy tells us if volume—basically how much money is moving in and out—is backing the price action. A rising OBV is usually a good sign. It means more people are buying than selling, which could keep pushing the price up.
And finally, the MACD. This one’s a bit trickier. Right now, it shows a slight bullish crossover. The MACD line is at 12.61, just above the signal line at 79.38, but the histogram is sitting at -17.76.
The crossover is a bullish signal, but the negative histogram says, “not so fast.” The market’s still unsure, and traders are looking for more solid ground before making any big moves.


