The latest Ripple analysis suggests a bearish trend for today and supports sellers as the price has undergone a considerable decrease since morning. Although the bears were in the winning position, a downtrend has been following the price since the start of today.

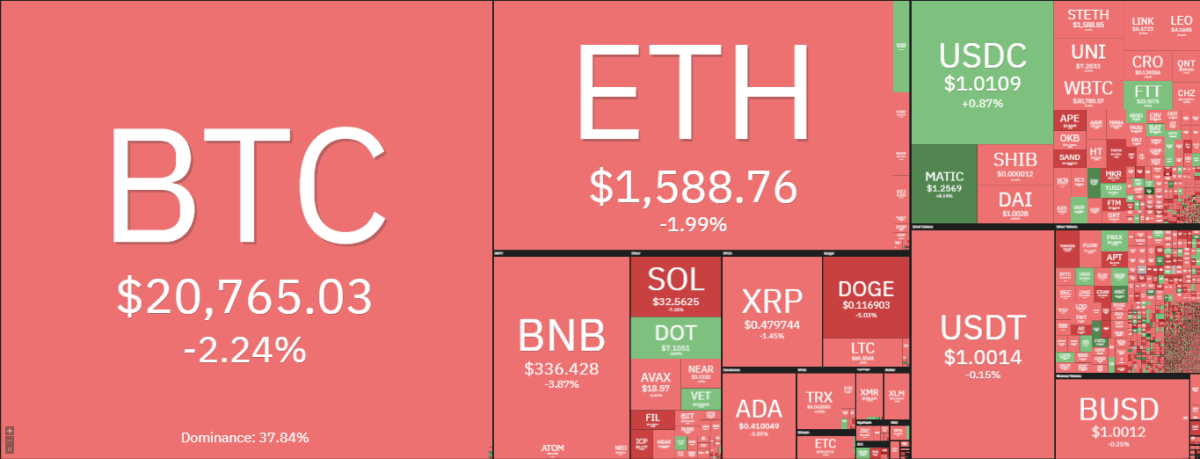
The overall market traded mostly in the red, with Bitcoin also losing some value against the USD. At the time of writing, XRP was trading at $0.4727 and saw a decrease of 3.59% in the last 24 hours. The market cap and 24-hour volume were $23.80 billion and $1.43 billion respectively.
Ripple price analysis 1-day price chart: XRP/USD spikes $0.4727 after consolidation overnight
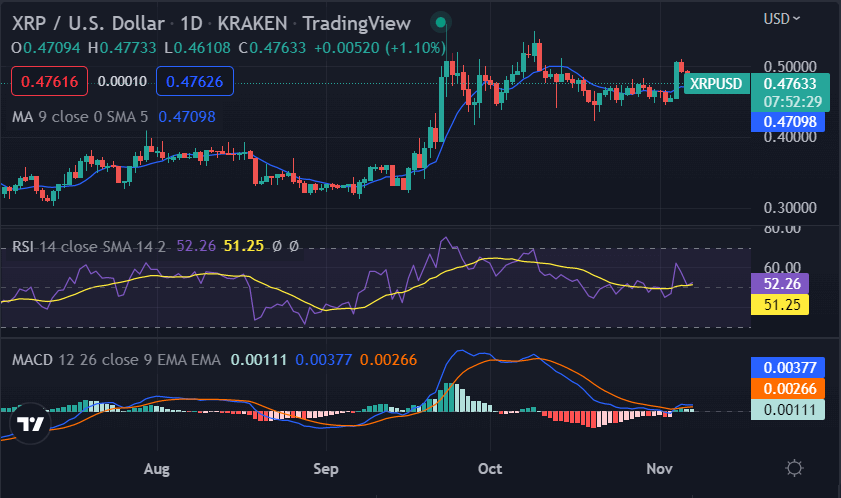
The 1-day Ripple price analysis shows bears are still in control and may continue to push prices lower in the short term. The price of XRP/USD fluctuated between $0.4632 and $0.4924 during the previous 24 hours, suggesting mild fluctuations in pricing. The bearish trend has again damaged the cryptocurrency’s value to a good extent as it plummets from the intraday high of $0.4924. The cryptocurrency was trading at a decent level of around $0.4727 as of now.

The 50-day moving average and the 100-day moving average acted as strong resistances for XRP, at $0.5168 and $0.5333 respectively, indicating that a bearish crossover is likely in the near future. The MACD also suggested bearishness as its line moved below the signal line, and the RSI indicator was at 38.60, showing that selling pressure dominated buying pressure in the market currently.
Ripple price analysis 4-hour price analysis: Latest developments
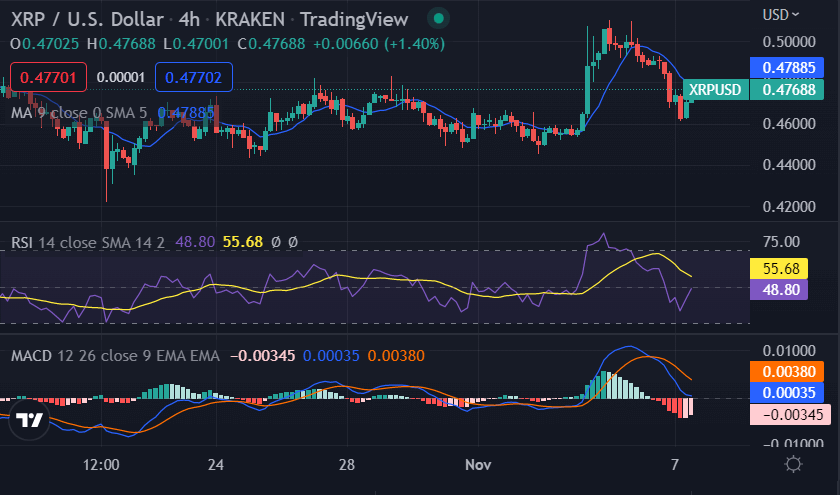
The 4-hour Ripple price analysis confirms the downtrend as the price has been trading below $0.46 for the last few hours. The price has formed lower highs and lower lows, which is a sign of bearish momentum in the market. The bulls have not been able to take the price above $0.47, which is a sign of weakness.

The relative strength index is currently at 55.68, and it does not show any extremities, which suggests that there are no oversold or overbought conditions in the market. The moving average value in the 4-hour chart is currently at the $0.4788 level, just above the current price. The MACD indicators also suggest bearishness as the histogram is narrowing and the MACD line is below the signal line.
Ripple price analysis conclusion
Today’s Ripple price analysis is bearish, as the upside was strongly rejected this today, indicating that bears are still in control. We anticipate that XRP/USD will continue to fall later today as a result.
Disclaimer. The information provided is not trading advice. Cryptopolitan.com holds no liability for any investments made based on the information provided on this page. We strongly recommend independent research and/or consultation with a qualified professional before making any investment decisions.


