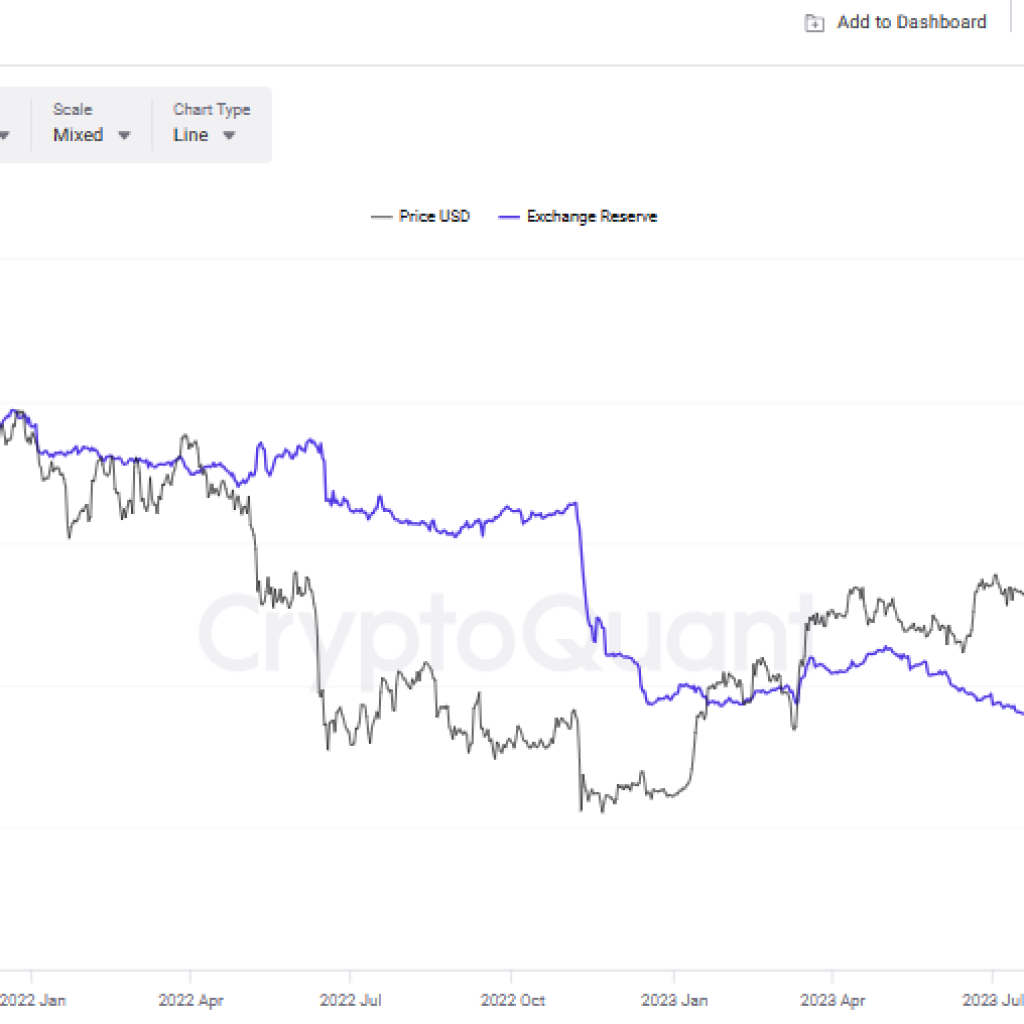
Bitcoin price trades in a 7-month range, and charts suggest the pattern could culminate with a strong downside move.
Since the beginning of October, Bitcoin’s (BTC) price has been consolidating within a roughly $3,400 range as the 200-day simple moving average (SMA) remained a resistance that BTC could not overcome.
Bitcoin has been stuck between its resistance level at $72,000 and $54,000 since dropping from its March 14 all-time high of $73,835. The direction of Bitcoin price is currently uncertain as the effects of an aggressively dovish Fed policy and stimulus measures in China fade.
BTC/USD daily chart. Source: TradingView


