TL;DR Breakdown
- Cardano price analysis suggests a downward movement to $0.3000
- The closest support level lies at $0.3217
- ADA faces resistance at the $0.3422 mark
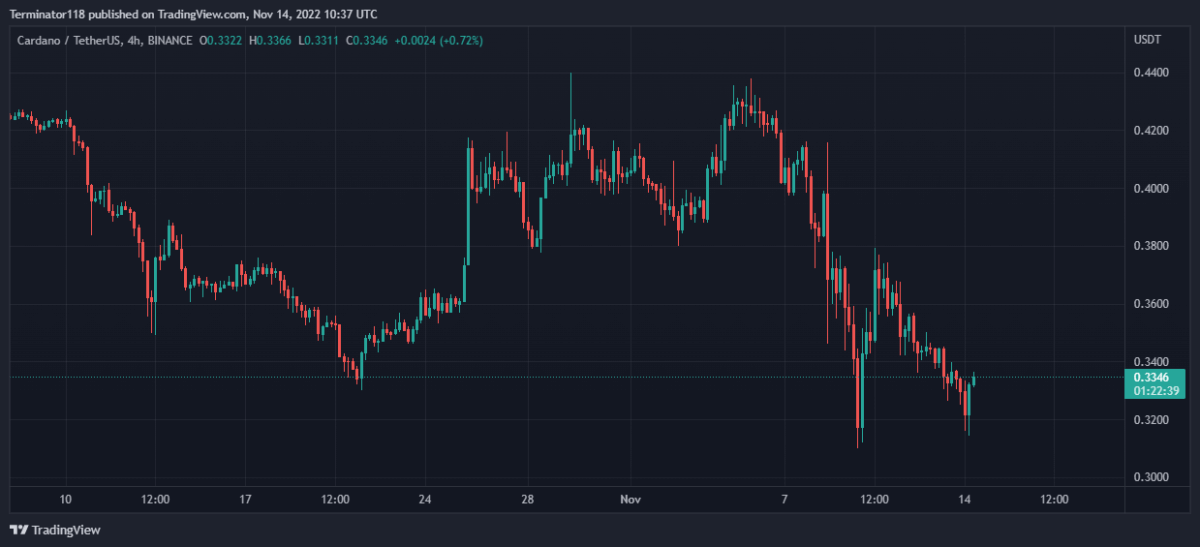
The Cardano price analysis shows that the price action finds resistance at the $0.3800 mark and has fallen back to the $0.3600 mark as the bulls recuperate.
The broader cryptocurrency market observed a positive market sentiment over the last 24 hours as most major cryptocurrencies recorded positive price movements. Major players include ETH and BNB, recording a 7.96 and a 7.06 percent incline, respectively.
Cardano price analysis: ADA returns to $0.3600

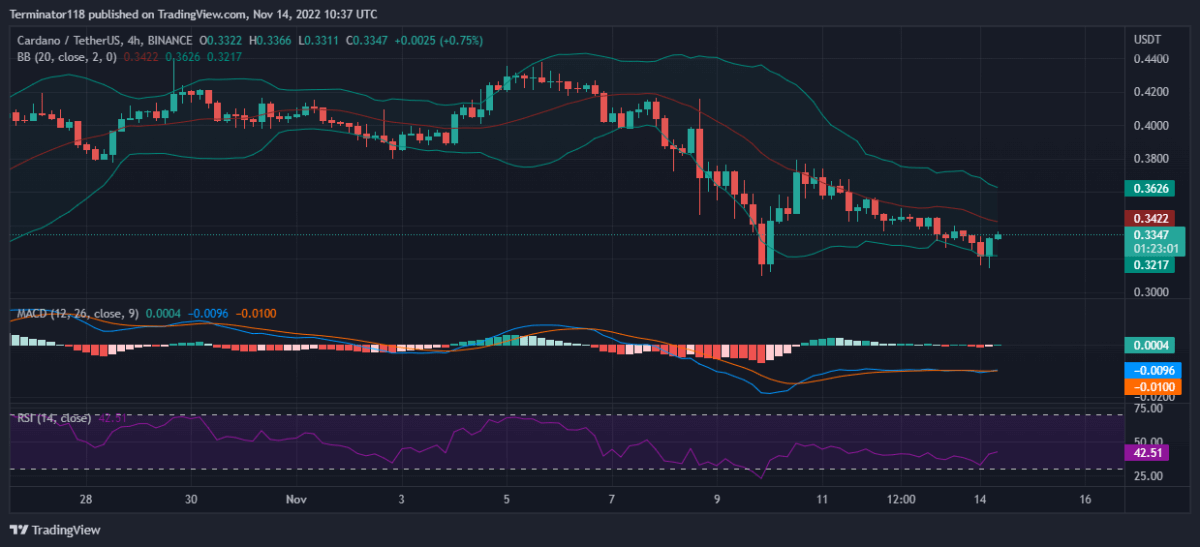
The MACD is currently bullish, as expressed in the green color of the histogram. However, the indicator shows little to no bullish momentum as expressed in the minute size of the histogram. The MACD has been showing low momentum on either side for the past 48-hours.
The EMAs are currently trading below the mean position as net price movement over the last ten days remains bearish. Furthermore as the two EMAs continue to move horizontally, the momentum is expected to remain low on both sides of the market. Currently, both the 12 and the 26-EMA are moving close together suggesting low trading activity in the market.
The RSI was trading near the oversold region yesterday as the index dropped to the 30.00 index unit level. Since then, the indicator moved back up towards the neutral region and climbed above the 40.00 index unit level issuing no signals. Currently, the indicator is trading with a slight upwards slope suggesting low bullish momentum.
The Bollinger Bands are converging recently as the price action stabilizes around the $0.33500 mark. At press time, the indicator’s bottom line provides support at $0.3217 while the mean line presents a resistance level at $0.3422.
Technical analyses for ADA/USDT
Overall, the 4-hour Cardano price analysis issues a buy signal, with 13 of the 26 major technical indicators supporting the bears. On the other hand, only three of the indicators support the bulls showing a low bullish presence in recent hours. At the same time, ten indicators sit on the fence and support neither side of the market.
The 24-hour Cardano price analysis shares this sentiment and also issues a sell signal with 15 indicators suggesting a downward movement against only one indicator suggesting an upwards movement. The analysis shows strong bearish dominance across the mid-term charts while showing little to no buying pressure for the asset across the same timeframe. Meanwhile, ten indicators remain neutral and do not issue any signals at press time.
What to expect from Cardano price analysis?

The Cardano price analysis shows that after observing a sharp price drop to the $0.3200 mark, ADA was able to defend the support level and the price started to recover. Currently, the bulls are trying to hold the $0.3200 support level while the bears hold firm around the $0.3400 mark.
Traders should expect ADA to move downwards towards the key support level at the $0.3000 mark.The suggestion is reinforced by both the 4 and the 24-hour charts. However, further downward movement is unlikely due to lower trade activity in the markets.


