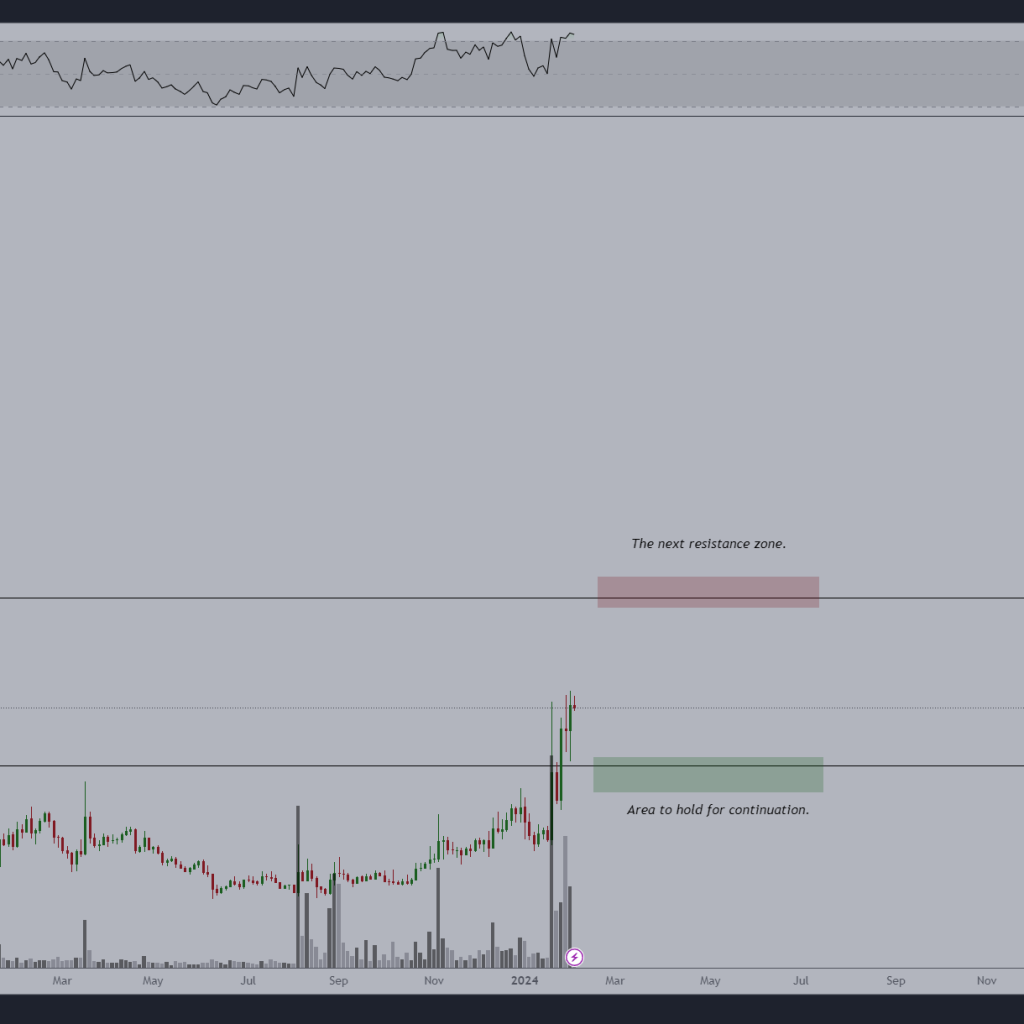
Bitcoin blasted into 2024 with a bang, rising over 4% on just the first Monday of the year. But after that surge, markets have been stuck in sideways action ever since hitting the all-time high some time in March.
The ‘Fear and Greed’ index doesn’t lie. It’s 2024, and Bitcoin has officially reached its greediest point in history, according to Copper. There’s been no serious dip to cool things off yet, but the market’s been shaky.
Bitcoin’s drawdowns resemble those of the 2015-2017 cycle, yet the demand/supply balance hasn’t moved much. It’s all been moving sideways for more than six months now, just like the price.
The sideways standoff
Crypto traders are getting impatient. Sure Bitcoin’s return year-to-date is above 40%, which is nearly double the S&P 500. You’d think people would be thrilled, but not in this space.
Traders have been waiting for continuation of the bull run all year, and they’re starting to get twitchy watching Bitcoin stay in neutral territory.
With the Fear and Greed Index showing more days in “Greed” than we’ve seen in a decade, it’s no surprise. The market feels heavy, and 2024 could end up looking a lot like 2023 unless something big happens soon.
There’s been some serious action in the market though. One of the most notable moments was a sell-off that dropped Bitcoin to around $60,000. That was one of the biggest single-day moves since early 2022.
Even with that kind of volatility, Bitcoin showed it could bounce back fast, thanks to its depth and liquidity, especially during off-hours when traditional markets were closed.
The maximum drawdown this year hit -26%, right in line with the corrections of past bull markets. It’s nothing new, but it sure keeps everyone on edge.
A big part of Bitcoin’s 2024 story is how tightly the price has been tied to exchange reserves. Copper’s data shows a nearly perfect correlation between Bitcoin’s price and the USD value of Bitcoin reserves held on exchanges.
When reserves fluctuate, the price moves right along with them. The market’s been reacting more to changes in reserves than to shifts in actual demand. It’s reactive, not driven by long-term demand, which makes for a very twitchy market.
But if you look at Bitcoin reserves in terms of quantity, not value, you see a different angle. From 2020 to 2024, reserves have stayed within a narrow range, even when prices have gone through major swings.
That means there haven’t been any significant outflows or inflows—nobody’s dumping or hoarding enough to make a difference.
The sideways price movement has everything to do with this balance between supply and demand. You’d expect reserves to deplete when demand is high, as people pull Bitcoin off exchanges to hold long-term.
That happened earlier in the year, driving Bitcoin to its all-time high. But since then, reserves have stayed stable. The price swings match the reserve levels, keeping things calm, at least on the surface.
ETFs and external factors
Institutional investors have been piling in this year. Bitcoin ETFs saw a flood of inflows, with a particularly strong week seeing $203.3 million pumped in.
These ETFs closed out the week with a six-day winning streak. The demand from these institutional players hasn’t let up, especially with the SEC approving Bitcoin ETF options on the NYSE just a few days ago.
Bitcoin dominance has also been rising. It’s now at a multiyear high of 58%, a level not seen since April 2021. The next key resistance level sits at 60%.
If Bitcoin hits that, it could lead to a major recovery for other Layer 1 coins. Outside of Bitcoin, external factors are affecting the market.
Japan’s inflation has remained weak, with headline inflation falling to 2.5% from 3.0%. This has kept the Japanese yen on a weakening trend, which, combined with strong US equities near all-time highs, has pushed a risk-on sentiment in the market.
Traders expect this sentiment to grow stronger as we head toward the US election. Bitcoin, being the ultimate risk-on asset, has benefited from this environment, hitting new three-month highs.
This week saw Bitcoin rally over 10%, almost hitting $69,000 on Bitstamp. Despite the surge, some traders are skeptical.
Roman, a crypto trader on X, called it a “fomo liquidity grab” and warned that Bitcoin would probably come back down to consolidate before breaking higher.
Data from Coinglass shows liquidity walls building on both sides of the spot price. Traders are keeping Bitcoin pinned in a tight range, waiting for the next big move.
Roman also pointed out the $68,400 level as a critical point. This price level has been a breakout zone since March’s all-time high. At press time, though, Bitcoin was worth $68,360.


