Today marks a bearish day for Binance coin price analysis. Throughout the last week, Binance coin has mostly traded in the reds and its price seems to gradually decrease. BNB price failed to consolidate on the positive momentum and dropped down to $270 yesterday, before further falling up to $258 at the time of writing.
Binance Coin has been subject to significant decline since November 6, at a high of $360.2, and the price has declined more than 25 percent since then. Over the next 24 hours, if bearish action is to continue and the price fails to maneuver above the 9 and 21-day moving averages, Binance Coin could move down to test support at $250.
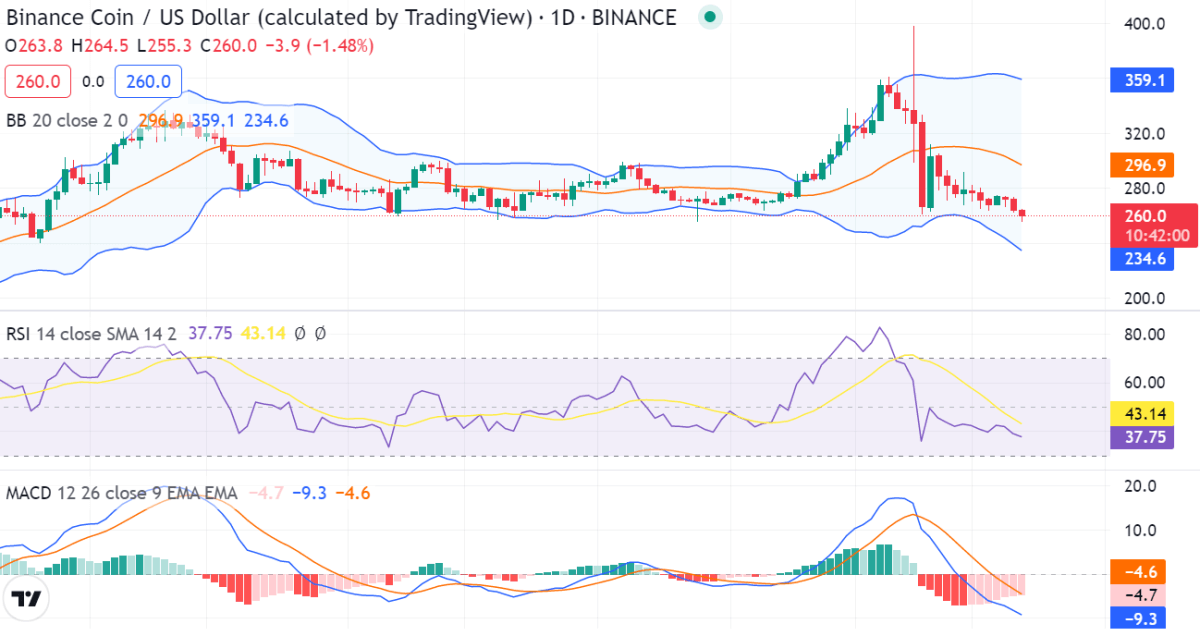
Binance Coin 1-day price chart: BNB further downtracks to $258.02
The 24-hour price movement of the Binance Coin has been very interesting. It was trading in a range for a good part of the day and the pump only occurred much later in the day. After pumping to $270, Binance Coin ended up facing significant resistance from the bears and fell, creating a reversed candle wick.

The majority of technical indicators are projecting a downward trend for BNB Chain with the Relative Strength Index score at 43.14. The Bollinger Bands have been wide for the past eight days. At press time, the indicator’s bottom line provides support at $234.6 while the upper limit presents a resistance level at $359.1. The MACD indicates declining signs with the MACD line (blue) below the signal line (red). The price is also trading below the histogram proving strong bearish action.
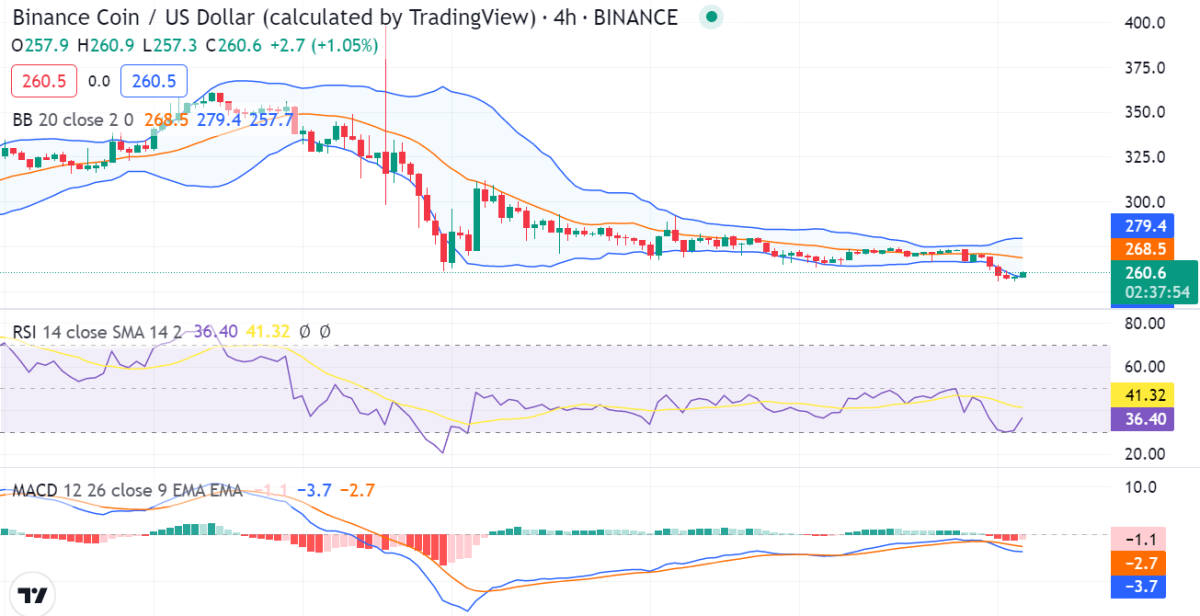
Binance Coin 4-hour price chart: Recent analysis and technical indicators
The Binance Coin price analysis shows that the bears have overpowered the bulls. The biggest question that investors have in mind right now is whether Binance Coin price analysis can retrace all the way to $260 again in the short term. The RSI score for Binance coin is facing the oversold end and is placed at the 41.31 mark. This is too low and suggests that the market has stayed oversold for a big chunk of the day. It also signifies a possibility of the bulls taking over in the near future.

The Bollinger Bands are still enlarging with the upper band $279.4 and the lower one at 257.7. The volatility in the market is at its high levels. The MACD line of the Moving Average Convergence Divergence indicator is below its signal line revealing a strongly bearish market.
Binance Coin price analysis conclusion
In conclusion, the Binance coin price analysis is supporting the sellers due to the persistent decline in the BNB/USD value. Given that the bears were still ahead of the game today, the price dropped to $258 in the previous 24 hours. If the support level at $256 stays firm, the bearish pressure can continue, pushing prices further lower. However, if the resistance level of $270.65 is broken in the upcoming weeks, buyers may look for a higher price entry point.
Disclaimer. The information provided is not trading advice. Cryptopolitan.com holds no liability for any investments made based on the information provided on this page. We strongly recommend independent research and/or consultation with a qualified professional before making any investment decisions.


