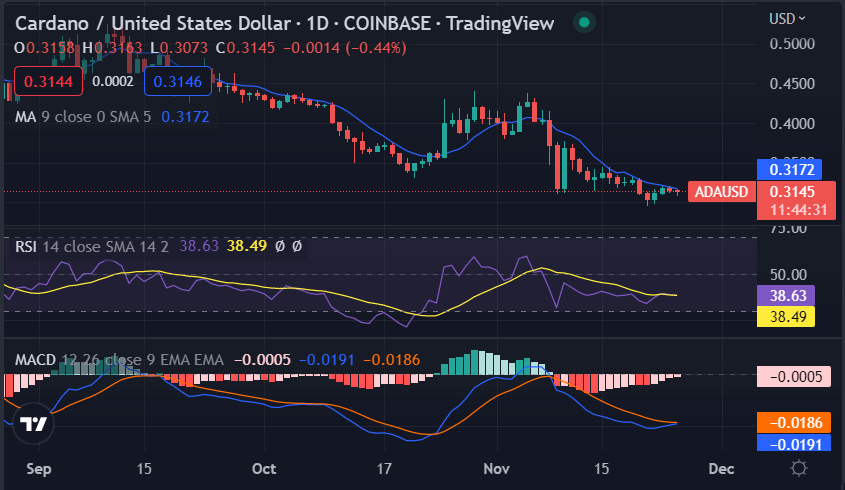
Cardano price analysis shows bullish momentum as the price is on the rise today. After gaining a considerable value yesterday, the price of the coin has increased further and continues to cover the range upwards. Bulls have recovered the losses faced during the start of the week, as mostly the trend was downwards. But as the market started to recover yesterday, ADA was one of the highest gainers, and the bullish trend has recovered the price up to $0.3146 today.
The next resistance for ADA is present at $0.3173, while the current support is present at $0.3083 point. The bears were also strong in the market and have managed to push the price down as well. However, it seems that the bullish trend is hard to resist, and pushed the price up today.
Cardano price analysis 1-day price chart: ADA to retest $0.3173 as resistance
The 24-hour Cardano price analysis shows that ADA/USD pair is still on an upwards trend, as now bulls are looking to challenge the $0.3173 resistance, which seems to be going under a test soon. The next target for bulls will be the previous swing high of $0.3173 which was observed yesterday, but bulls were unable to hold the position for long as the price came down the very next day, and now it is the next inline resistance for bulls to encounter.

The moving average (MA) is trading at the $0.3172 level after crossing over the SMA 50 curve, which is a bullish crossover. The relative strength index (RSI) is trading at index 38.49 near the over-bought limit at a steep upwards slope, giving a hint for present buying activity. The MACD indicator shows bullish activity and a possible crossover soon, which will further strengthen the positive sentiment for the bulls.
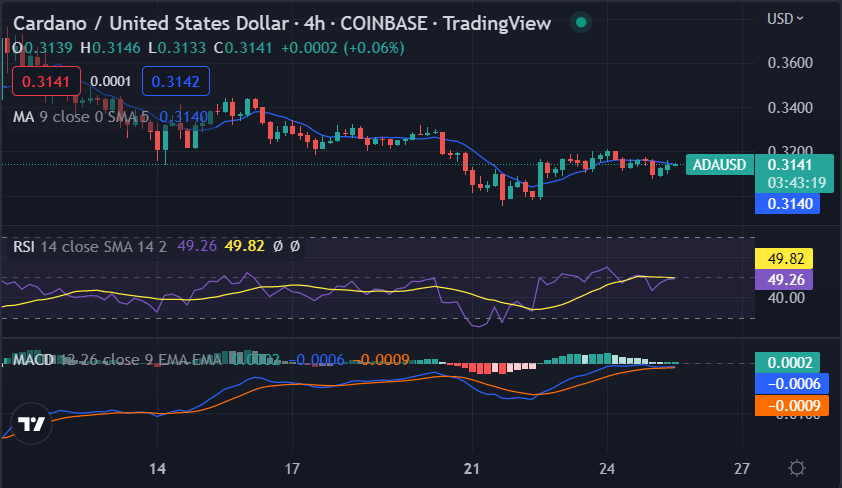
Cardano price analysis: Recent developments and further technical indications
The 4-hour Cardano price analysis shows that ADA continues to race high as the price has been on an increasing trend for the last few hours. The correction observed at the end of the last trading session also continued for the first four hours of today’s trading session as well as the price breakout was downwards, but later on, bulls made an aggressive comeback and have made further gains.

The MACD indicator shows bullish momentum, but the price is also facing resistance from a short-term moving average curve at $0.3140. The hourly RSI indicator is trading at 49.82, which means that bulls currently have an upper hand in the market and are more likely to continue their upwards gains. The MA indicator is on for 4 hours and is currently at the $0.3140 mark.
Cardano price analysis conclusion
Cardano price analysis suggests the cryptocurrency is enjoying a bullish swing today. This is a very encouraging sign for the buyers if the coin can sustain the price levels for the coming days, However, trading the market can be risky so it is important to follow a strong strategy. Nevertheless, overall sentiment in the market seems positive and investors will likely continue to see returns on their investments.
Disclaimer. The information provided is not trading advice. Cryptopolitan.com holds no liability for any investments made based on the information provided on this page. We strongly recommend independent research and/or consultation with a qualified professional before making any investment decisions.


