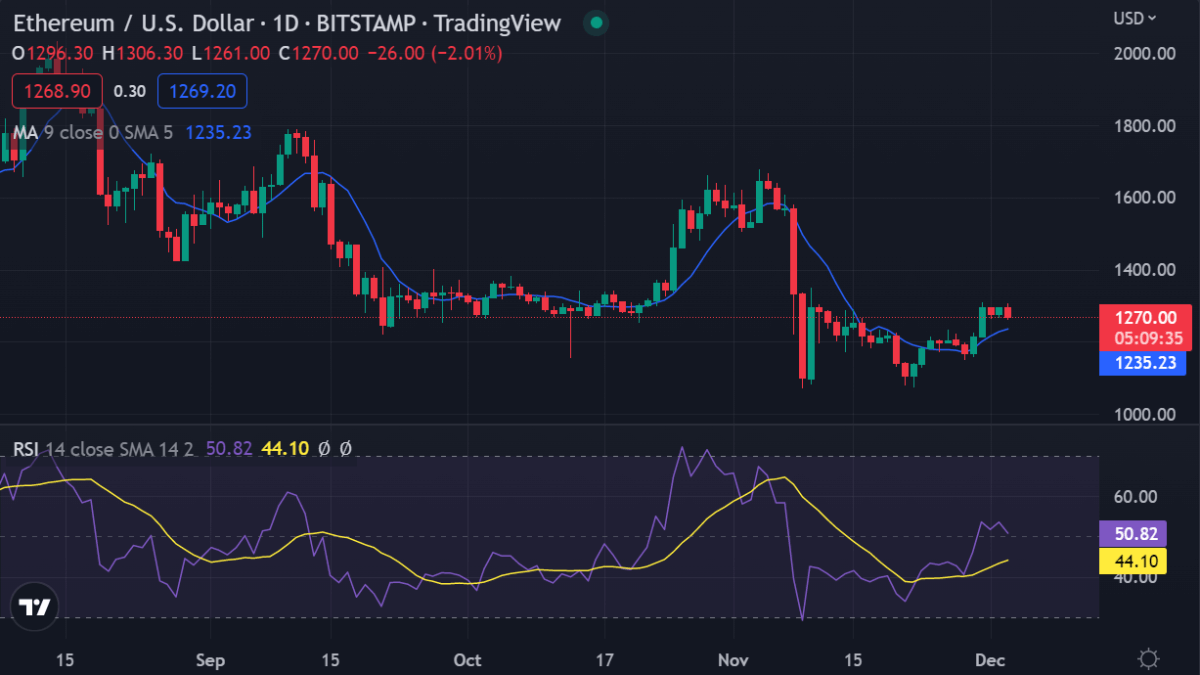
Ethereum price analysis indicates ETH is still trading inside a descending channel pattern but the bulls have made several attempts to make a move above $1,300. ETH has been trading inside a descending channel pattern since the beginning of December and price action is currently trending below the upper boundary of this range. A falling channel pattern forms when there are lower high and lower low prices which reflect a downtrend in price. Ethereum has been making lower highs compared to October all through November when a bear market engulfed the cryptocurrency market.
In a falling channel pattern, the price action has to decline until it reaches the lower boundary before reversing and moving higher. This is exactly what Ethereum is doing currently as it consolidates below $1,300 with an aim of making higher highs in the near term. The bulls have been able to defend at this level multiple times over the past few days and Ethereum is likely to make a break above this key resistance level soon.
If ETH manages to close above $1,300 on a daily basis, it could signal a move higher toward the 50% Fibonacci retracement level at $1,350. A failure for Ethereum price analysis indicates that more declines could be on the cards as ETH drops toward $1,100.
Ethereum price analysis on a daily chart: ETH remains in a descending channel
The daily chart for Ethereum price analysis shows that ETH opened the daily trading session on a bullish note, recording a daily peak of $1,297.59. The price action soon corrected lower, breaking below the immediate support at $1,290. ETH is now trading at $1,270.91, down by 0.78 percent in the last 24 hours. Ethereum price analysis also shows that ETH is still trapped inside a descending channel pattern as it trades lower lows and lower highs in a downtrend. The bulls have been able to make several attempts to break above $1,300 but these moves have been thwarted by the bears.

The RSI is posting a bearish divergence and has begun to move toward 50 which indicates that the bears are losing control of momentum as the bulls try to push more aggressively for a break above $1,300. ETH has also been trading in a falling wedge pattern and the price action is currently trending below the 21-day EMA while the 50-day SMA continues to point higher.
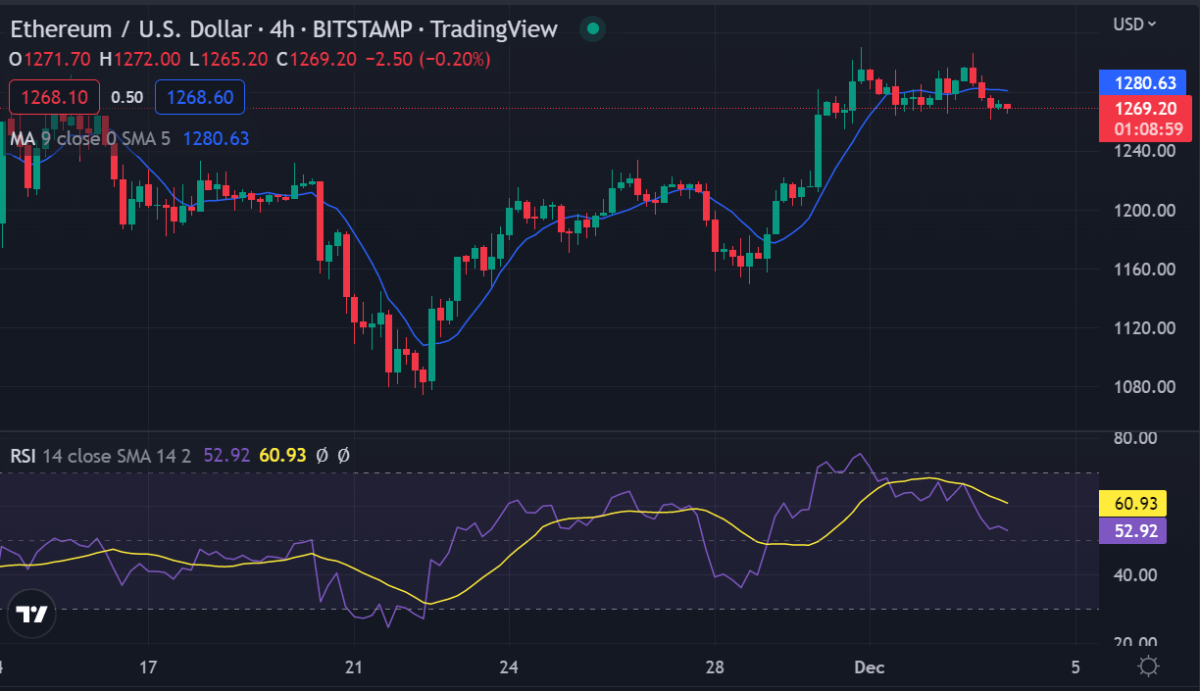
Ethereum price analysis on a 4-hour chart: ETH consolidates below resistance at $1,300
The 4-hour chart for ETH/USD price analysis shows that ETH started falling in the last four hours and is trading in a horizontal channel pattern with resistance at $1,300. The price action has been moving lower after the bulls failed to make any strong move above $1,300.However, the bulls are still in control and a close above $1,300 could set off a strong bullish rally toward the 61.8% Fibonacci retracement level of $1,350. On the other hand, ETH needs to close below $1,250 before shifting the balance of power in favor of the bears.

The RSI is also indicating that the bears are losing steam as it depreciates from overbought levels while ETH looks to close above $1,300. The 100 SMA is still below the long-term 200 SMA which points to a possible downside break in price action. However, ETH has been trading above the 21-day EMA and this could see the bulls try to push higher in the short term.
Ethereum price analysis conclusion
Ethereum price analysis shows that ETH has been trending in a descending channel pattern and the price action is currently consolidating below $1,300. Ethereum might break out of the channel pattern in the next few hours and if it does, ETH could retrace all the way to $1,350.
On the other hand, a break below $1,250 could see ETH drop toward $1,100 where it is likely to find support. The RSI has been providing mixed signals as it trades near 50 in both conditions.
While waiting for Bitcoin to move further, see our long-term price predictions on Chainlink, VeChain, and Axie Infinity.
Disclaimer. The information provided is not trading advice. Cryptopolitan.com holds no liability for any investments made based on the information provided on this page. We strongly recommend independent research and/or consultation with a qualified professional before making any investment decisions.


