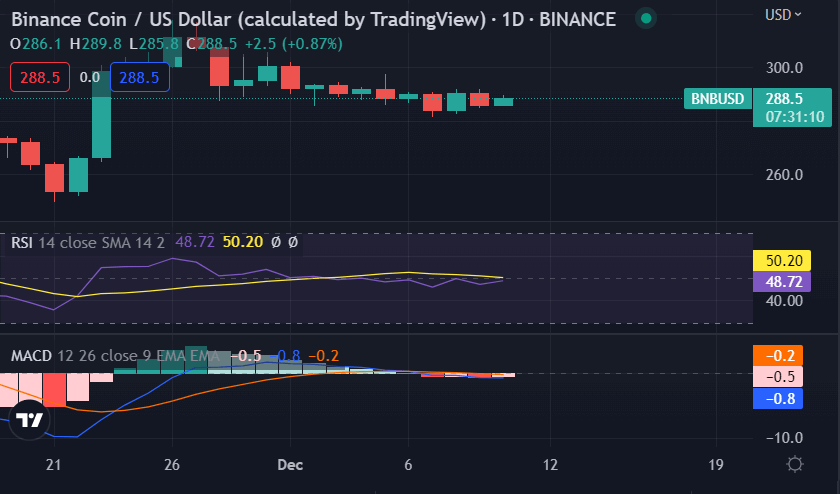
Binance coin price analysis indicates the market sentiment has shifted to the bearish sentiment after a period of sideways trading over the last few days. The bearish sentiment is however weak as the price of the BNB coin is down by a small figure of 0.35. The exchange currency established a higher low on the daily chart at $285.64 compared to yesterday’s figure of $295. As a result, we anticipate that BNB/USD will correct to a higher low in the next 24 hours.
The BNB coin opened the daily trading session at $289.99 and is currently trading in a range of $285.58 and $290.16 as per data from CoinMarketCap.The Binance coin is down by 0.35 percent which indicates the bears are trying to enter the market after a period of consolidation around $280.0.Binance coin is trading at $288.85 after the failure of a potential upside breakout that was looming over the last seven days.
Binance coin price analysis: BNB coin price remains dormant at around $280.0
Binance coin price analysis on a daily chart reveals the cryptocurrency has yet to make significant price changes and is currently stuck in a tight range.BNB coin prices have retraced slightly from the $296.0 level, but the overall trend on the daily chart remains bearish as prices continue to trade below the key 50-day moving average. With price action looking relatively stable for now, traders are waiting to see if BNB can break through the $300.0 resistance and move higher toward $350.0. If it fails to do so, however, there is a risk of a pullback toward support at $250.0.

The Fibonacci retracement levels show that the immediate support for the BNB coin is at $280.0 and $285.0 respectively. The next major support level is found to be at $230.5 before the digital asset finds strong buying pressure around the $200.0 mark.
The MACD indicator shows increasing bearish momentum as the moving averages move further closer to each other. The RSI indicator also supports a bearish sentiment as it is approaching $30.0 oversold levels. The bulls are defending the key support level of $280.0 which if broken could pull the BNB price toward $250.0.
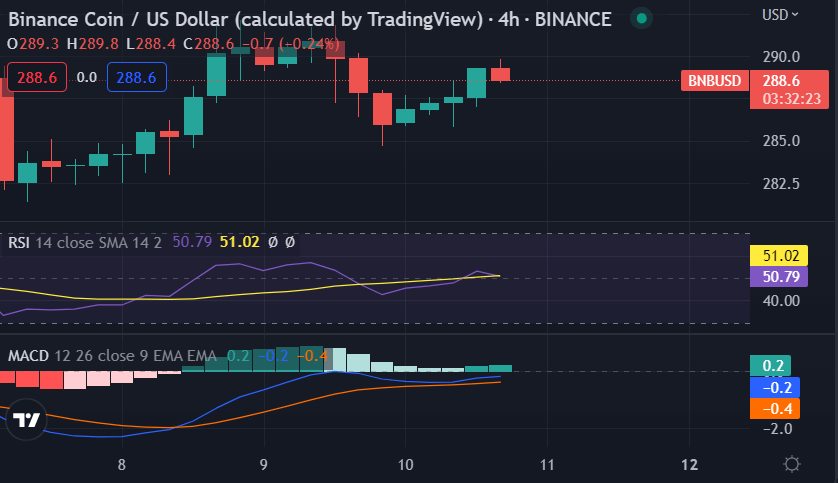
Binance Coin price analysis on a 4-hour chart: A bullish reversal pattern forms
Binance coin price analysis on a 4-hour chart indicates the market might rebound and trade in a bullish trend, as per the technical indicators. The MACD line has made a crossover on the bullish

sentiment, suggesting a potential upside in the next few hours. So far, it looks like bulls are likely to regain control in the short term, as the relative strength index (RSI) is still trending higher and may indicate a further rally in Binance coin prices.
Binance Coin price analysis conclusion
Binance coin price analysis shows the price action is retesting the $280.0 support level. If the current support fails, we might see the price drop down to support at $250. BNB has been particularly bullish in the month of November, forming a new monthly high of $315. The trading volumes surged, showing an increased interest of investors in the exchange coin.


