The coin has retraced back to $13.42 today, according to the Avalanche price analysis, and is currently going sideways. AVAX/USD is currently trading in the red due to selling pressure, which is negative overall. The coin’s value had recovered somewhat over the previous two days, if only little, but today the bears took control, and AVAX’s price movement was sideways with a slight value deficit. Nevertheless, over the past four hours, the price has begun to rise once more.
AVAX/USD 1-day price chart: Bearish pressure still persists
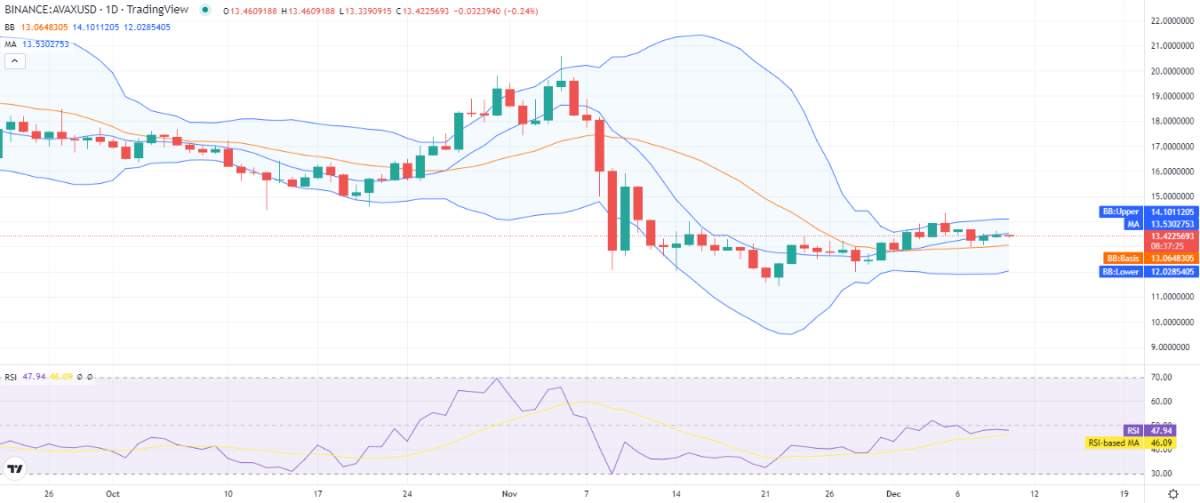
According to the 1-day price chart for Avalanche price analysis, there has been a decline in price today. After reaching a high of $13.60 yesterday, the price dropped to $13.34 today. However, a brief upward retracement was also seen, and the price is now 13.46 at the time of writing. The trading volume has decreased by 25.31% today, with the AVAX/USD reporting a 0.21 percent loss in value over the previous 24 hours and the crypto pair reporting an additional 0.51 percent loss over the previous week. However, over the past 24 hours, the market cap has declined by 0.19 percent.

Because the Bollinger bands indicate that the top limit of the indicator is at $14.10, which indicates resistance for the AVAX, and the lower limit is $12.02, which shows support for the coin price, there is only moderate volatility for AVAX/USD. The SMA 50 curve is at $13.06 and the moving average (MA) is at $13.53, above it.
The relative strength index (RSI) also follows a horizontal movement as it shows sideways movement in the lower half of the neutral zone at index 47, indicating yet an undecisive trend for the market.
Avalanche price analysis: Recent developments and further technical indications
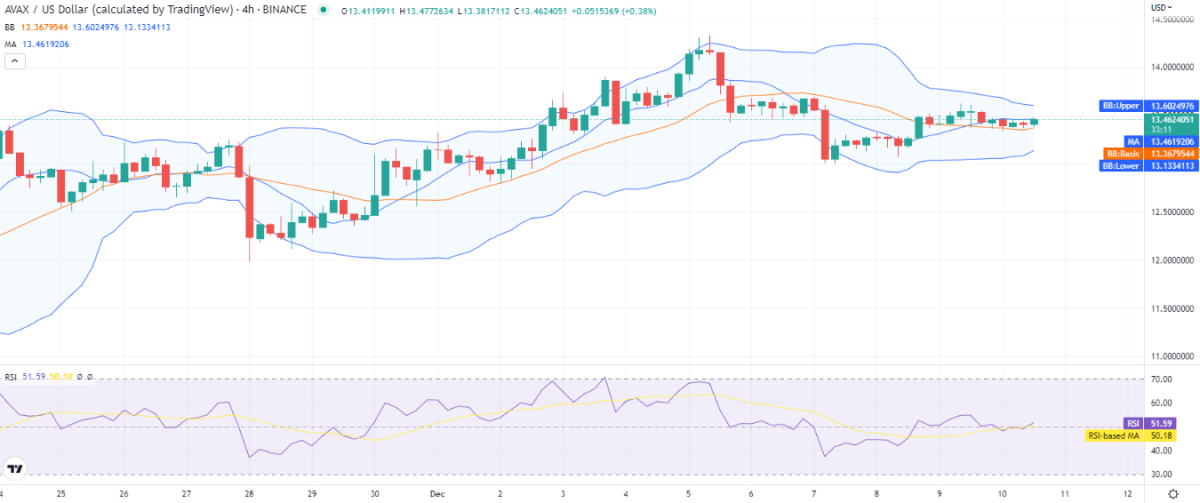
The price breakout was downward at the beginning of today’s session, and a very quick devaluation was seen. Later, however, bulls took control of the price function, and the price has been recovering ever then, albeit both the fall and the recovery rate have been gradual.

The RSI is currently moving slightly upward, indicating that buyers have returned to the market, but the volume of buying activity is about equal, suggesting that a trend change may still be imminent. On the 4-hour chart, the price has retraced close to the moving average, signaling a positive crossover. As the Bollinger bands converge, the volatility is reducing. AVAX price resistance is represented by the indicator’s upper band at the $13.60 level, and price support is provided by the indicator’s lower band at $13.13.
Avalanche price analysis conclusion
After experiencing losses late last evening, the coin appears to be retracing once more, according to Avalanche price analysis. The return of the buying impulse is currently reversing the overall bearish Avalanche. Although the price deficit has been relatively minimal thus far, the major trend has not yet been identified.


