Cardano price analysis shows price hanging in the balance at current trend, but expected to make a bullish run up to $0.379 by close of day. Over the past 24 hours, price has been hovering around the $0.31 support region, settling after a move down to $0.308 on December 7. While a move down to $0.299 bearish return remains a possibility, a quick turn around within the $0.30-$0.31 range could bring bulls into the market. A move upwards could also propel bulls into targeting the next resistance point at $0.321. A successful move up to that point would enable the “Ethereum killer” to target the $0.379 level next.
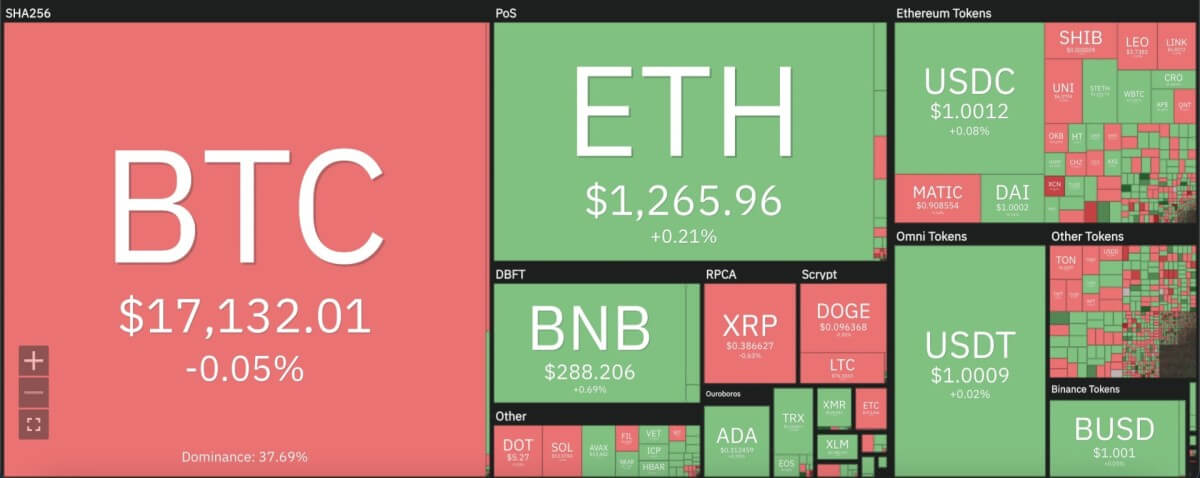
The larger cryptocurrency market largely showed minor decrements over the past 24 hours, as Bitcoin stayed above the $17,000 mark and Ethereum above $1,200. Among leading Altcoins, Ripple suffered a minor decline on the $0.386 mark, whereas Dogecoin dropped slightly from the $0.097 level. Meanwhile, Solana and Polkadot stayed at $13.57and $5.26, respectively.

Cardano price analysis: Price falls below crucial moving averages on 24-hour chart
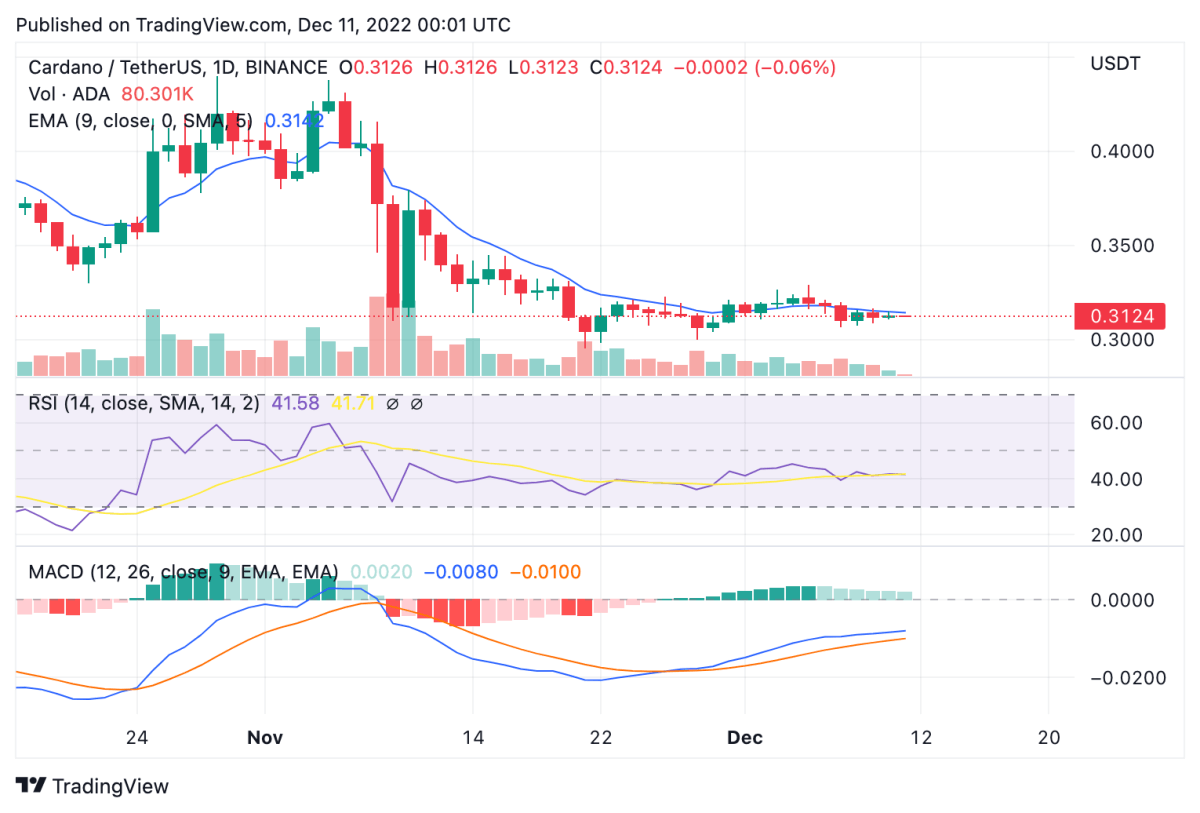
On the 24-hour candlestick chart for Cardano price analysis, price can be seen forming a horizonal trend around the $0.31 support zone since November 28. Since then, ADA bulls have failed to conjure any major breakout, and price has fallen just below the 9 and 21-day moving averages on the daily chart, along with the crucial 50-day exponential moving average (EMA) at $0.316. Trading volume showed a 40 percent decrease over the past 24 hours, suggesting of continued stagnancy in market for ADA.

The 24-hour relative strength index (RSI) shows a horizontal trend to mimic price movement from the past week, and has settled around the early 40’s, just above the oversold zone. The moving average convergence divergence (MACD) curve also shows a bearish divergence set in place. A quick bullish turnout up to the $0.32 mark could change the entire picture for ADA. However, a bearish drop down to $0.299 could invalidate the bullish sentiment.
Disclaimer. The information provided is not trading advice. Cryptopolitan.com holds no liability for any investments made based on the information provided on this page. We strongly recommend independent research and/or consultation with a qualified professional before making any investment decisions.


