Polkadot price analysis shows an increasing trend for cryptocurrency as the coin value has increased today. Earlier, the market value of Polkadot had been sinking for the past few hours as a continuous bearish wave seemingly took over the market. But the price function followed a bullish movement, and now the price is trading at the $5.14 mark. The chances of further bullish growth seem quite near as the bearish resistance is very low. The resistance for the DOT/USD pair is currently at $5.19, and the support is at $5.01. Polkadot has increased by 0.04% in the last 24 hours, with a trading volume of $206,240,775 and a live market cap of $5,900,322,934. Polkadot ranks at #12 in the cryptocurrency market.
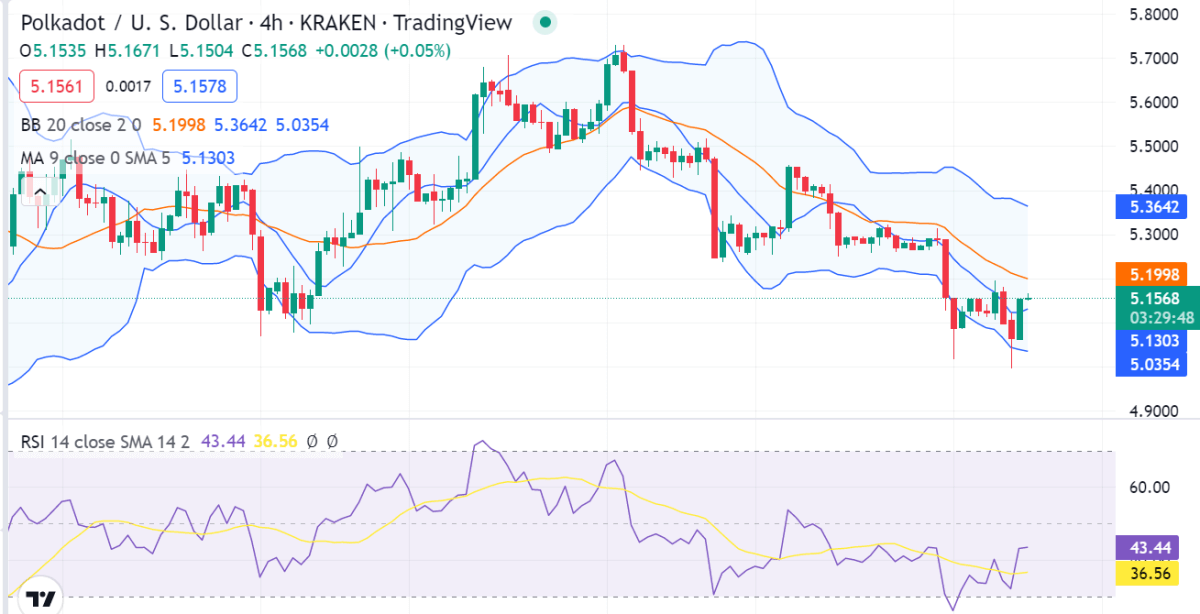
DOT/USD 4-hour price chart: Strong bullish momentum persists
The 4-hour Polkadot price analysis supports a strong positive trend for today given the coin’s significant increase in value. The bulls have been able to defend the crucial support level of $5.01 and are trying to make a move higher. Polkadot price analysis shows that market volatility follows an ambiguous closing movement, which makes DOT prices less susceptible to volatile fluctuation. As a result, Bollinger’s band’s upper limit is $5.3727, acting as the strongest resistance point for DOT. Conversely, the lower limit of Bollinger’s band is at $5.0390, representing the strongest support.

The Relative Strength Index (RSI) indicator is currently 36.27, which falls in the undervalued region. The RSI score follows a downward movement in the undervalued region, signifying future devaluation. The DOT/USD crosses over the moving average curve, indicating a bullish movement in the market. Furthermore, due to the recent breakout, the price appears to be moving further downward, with a strong possibility of breaking the support once again.
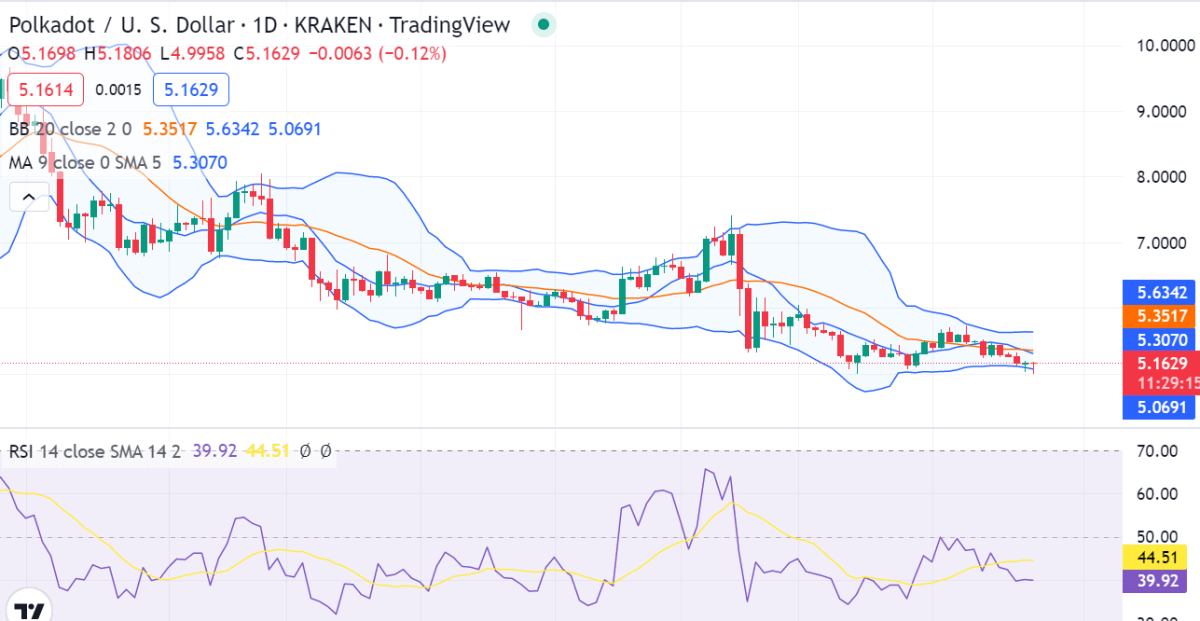
Polkadot price analysis on 1-day chart: DOT plummet amid bearish fight
The 1-day Polkadot price analysis predicts a downward trend for the market as the selling momentum remained high during the day. The bears have successfully tackled unfavorable circumstances as the bullish current has been disrupted. The price is now at $5.13, and further devaluation is to follow if the selling activity experiences a further rise.

The DOT/USD price appears to cross under the Moving Average curve signifying a bearish movement. The price moves downward toward negative dynamics. The bears appear to have taken control of the market and are on track to keep it that way for the foreseeable future. The Relative Strength Index is at 44.49, which indicates that the cryptocurrency is stable. The Bollinger’s band’s upper limit is $5.635, acting as the strongest resistance point for DOT. The lower limit of Bollinger’s band is present at $5.0671, representing the strongest support point for DOT.
Polkadot price analysis conclusion
To conclude, cryptocurrency has enormous potential for growth; but, at the moment, the market appears to be favoring a potential breakout, which might be profitable for the bulls. They might turn the market around and seize control of it.
Disclaimer. The information provided is not trading advice. Cryptopolitan.com holds no liability for any investments made based on the information provided on this page. We strongly recommend independent research and/or consultation with a qualified professional before making any investment decisions.


