Uniswap price analysis shows a downward trend since the bears have had an advantage over the market for the past 24 hours. The current price action displays negative momentum. The value of UNI/USD is down to $5.37 with nearly 0.21% losses. If the price of UNI continues with the bearish outlook, it will likely drop toward the $5.34 support zone. This price currently ranks 17 in cryptocurrency. If it fails to hold this support, the token could plunge toward $5 and possibly lower. The 24-hour trading volume surged 55.18% at $47,619,850 and the market capitalization for UNI/USD pair is currently at $4,091,433,018.
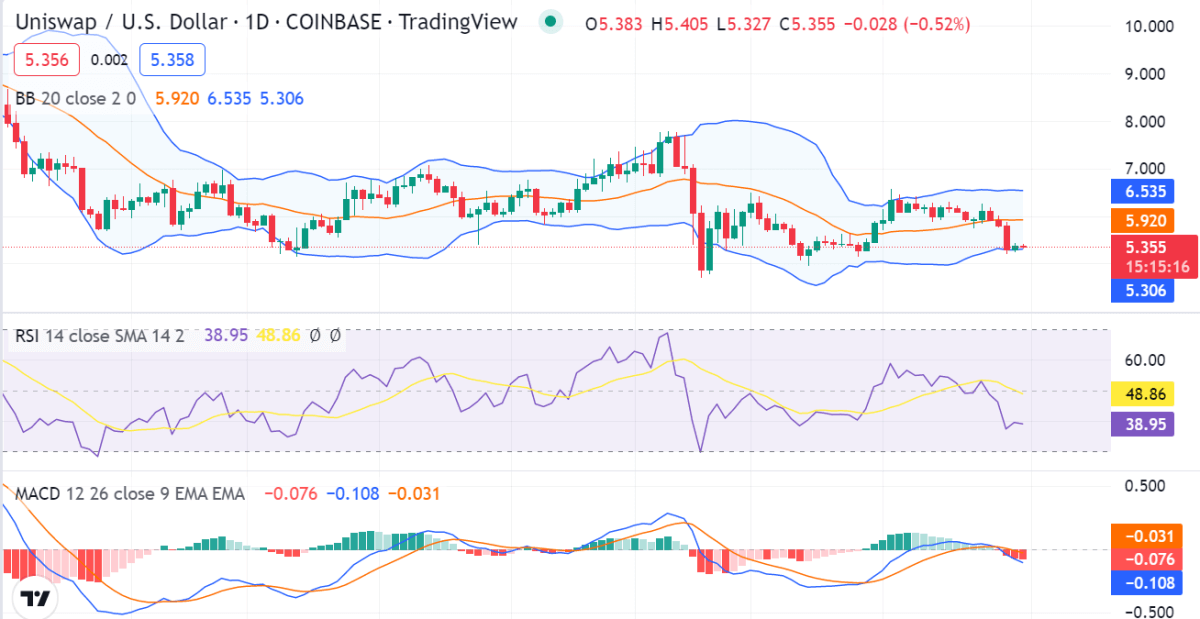
Uniswap price analysis on 1-day chart
The 1-day Uniswap price analysis chart shows that the crypto has been on a downtrend for the last 24 hours. The disruption of the bullish trend has allowed the bears to successfully deal with the unfavorable situation. The price is at $5.37, and if selling activity continues to increase, additional devaluation will occur. Volatility is increasing, which is a generally unfavorable sign of future market movements. The current value of the upper Bollinger band is $6.535, while the current value of the lower Bollinger band is $5.306.

The Uniswap Relative Strength Index (RSI) indicator is currently at 48.86 and is close to overbought territory, which indicates that the prices are probably going to increase again soon. The moving average convergence and divergence (MACD) line is below the signal line which is an indication of bearish momentum.
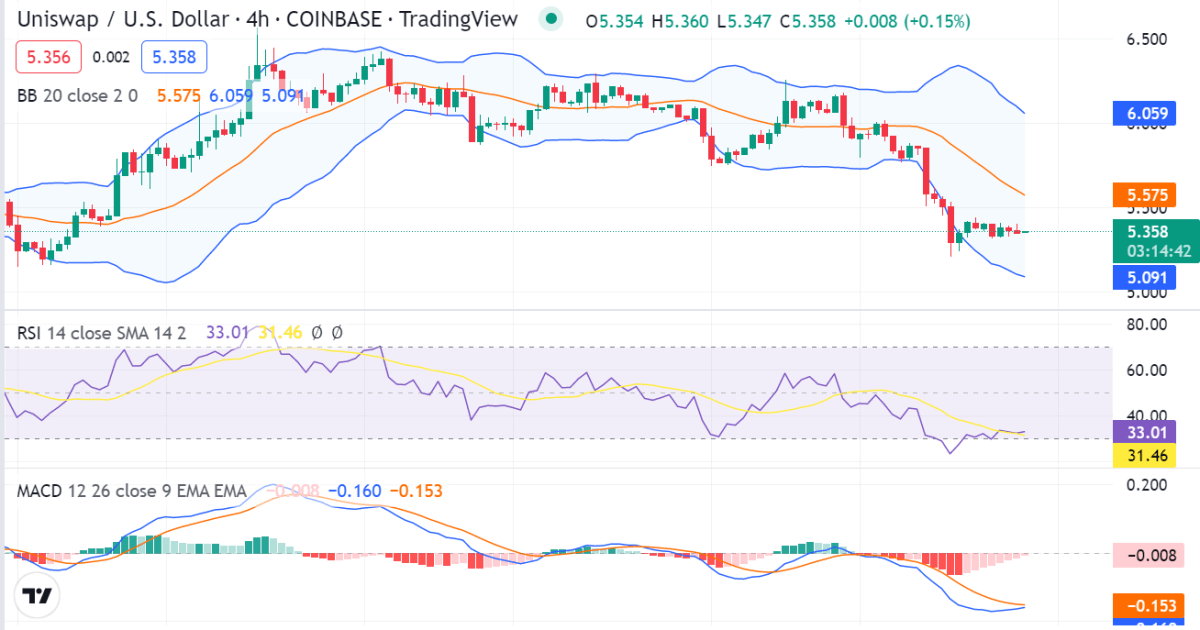
UNI/USD on 4-hour price analysis: Latest development
The UNI/USD cryptocurrency’s 4-hour price analysis is bearish because the market rejected the previously-used resistance level of $5.43, it formerly served as the coin’s resistance. Uniswap has continued with a bearish outlook in the last 24 hours. During this time, the Uniswap price dropped by 55.18%, trading at $5.37 at the time of writing. Following an initial movement, market volatility is revealed by Uniswap price analysis. This indicates that Uniswap’s price is getting more vulnerable to fluctuations in either direction and showing further falling characteristics.

The upper limit of Bollinger’s band is $6.059, while the limit is $5.091, which is the current market price and the first level of support. The signal line is above the MACD line, which shows a downward signal. The Relative Strength Index (RSI) indicator is trading at 31.46, which reveals bearish momentum. This indicates that it is now undervalued and that a price recovery may happen soon.
Uniswap price analysis conclusion
To conclude the negative conditions for cryptocurrencies, the following one-day and four-hour UNI price analysis predicts a drop in price today. The price has fallen to the $5.37 range as a result of the bears’ efforts to keep up their strong momentum. However, the market is currently dominated by bears, and lowering volatility works in their favor.
Disclaimer. The information provided is not trading advice. Cryptopolitan.com holds no liability for any investments made based on the information provided on this page. We strongly recommend independent research and/or consultation with a qualified professional before making any investment decisions.


