Cardano price analysis shows a strong bearish trend today for the price of ADA/USD as bears gain more market control. At $0.2638, the ADA/USD pair is getting close to the $0.2631 support level. Cardano’s stock is currently experiencing a bearish market sentiment as a result of investors’ continued caution regarding the state of the market. The overall market capitalization for ADA/USD pair is currently at $9,095,209,615, and the trading volume has crashed by 37.08% and is now trading at $145,854,229.
Cardano price analysis 24-hour chart
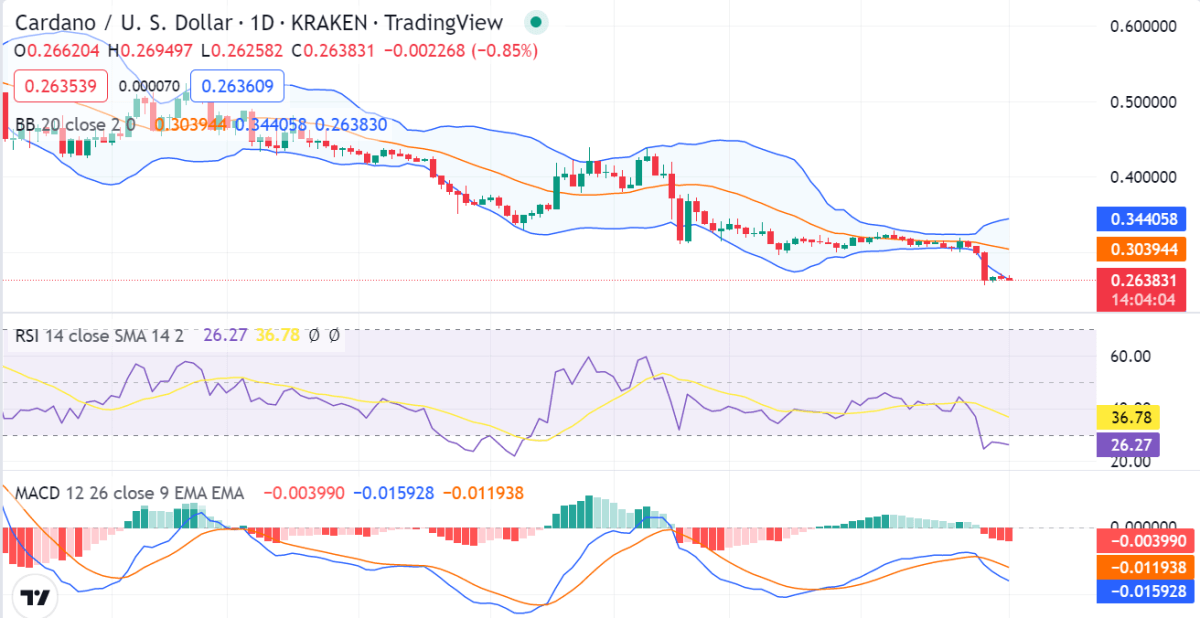
The 1-day Cardano price analysis reveals a downward trend as the bears are in control of the market. The ADA/USD has lost a 0.93% value and is now trading at $0.2638.Cardano remains in a firm bear grip. If the $0.2631 support cracks, the pair could resume its downtrend toward $0.25.This timeframe’s Bollinger Bands are reasonably close together, which is a sign of minimal market volatility, which is an indication of bearish pressure in the market.

The upper Bollinger Band is located at $0.3440, while the lower Bollinger Band is at $0.2638.The relative strength index(RSI) is currently at 36.77, indicating a negative move at this point as long as selling pressure is present. The MACD line is below the signal line which is anticipated to produce additional downside momentum given that it is in the bearish zone.
ADA/USD 4-hour price chart: Recent updates
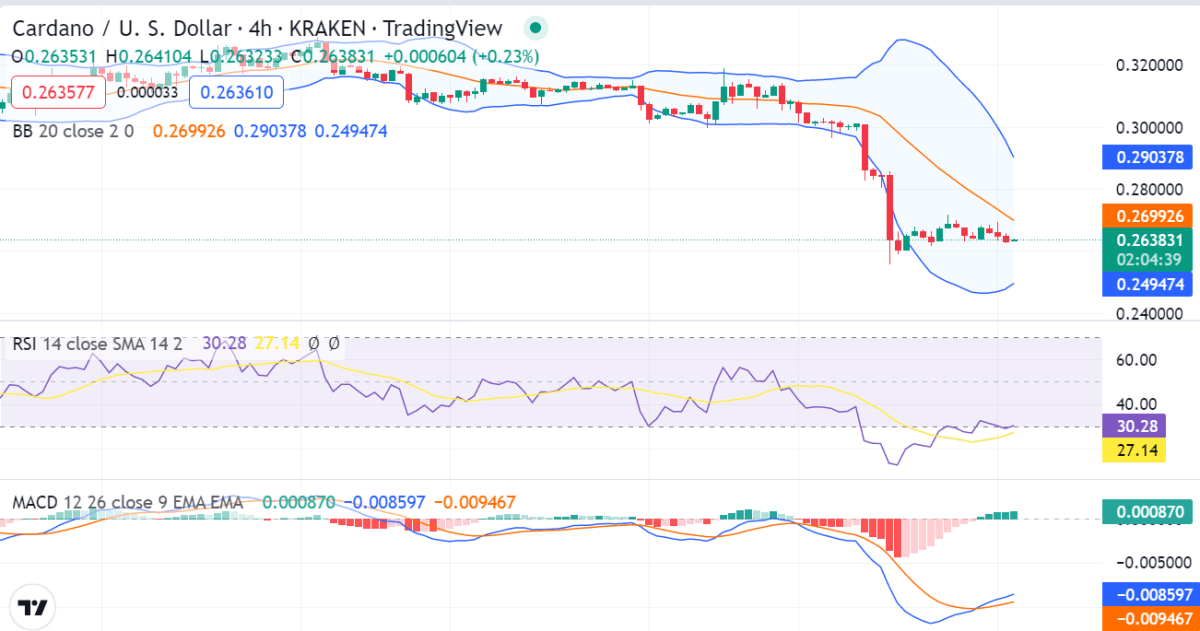
The 4-hour price chart for Cardano price declines demonstrates a bearish momentum in the market. Given that there is still a lot of selling pressure in the market right now, the bearish trend is anticipated to continue. The Bollinger bands indicators are very crucial for letting us know about the current market patterns. Its upper band displays a value of $0.2903 while its bottom band displays a value of $0.2494, signifying resistance and support, respectively.

The daily MACD is bearish, and the histogram is making lower lows again, which indicates the selling momentum may pick up again. The Relative strength index(RSI) for ADA/USD pair is trading at 27.14 and is falling toward the oversold territory, which is a sign that the bears are in control of the market.
Cardano price analysis conclusion
To conclude, Cardano’s price analysis demonstrates that the currency is correcting today and might be in a downtrend for the rest of the day as the bears try to drive the prices below $0.2638. The market has been ruled by bears. However, as long as the adverse winds blow, the market indications indicate further downside momentum in the near future. Regarding the current economic situation, investors continue to be cautious. If there is further selling pressure, prices will keep dropping.


