Polkadot price analysis shows that there has been a downward trend for the cryptocurrency today since the bears are in charge and are likely to keep up their pace. The price has dropped to the $4.61 level because of the bear. The coin has lost 0.91% in the last 24 hours as the bearish momentum continues. The overall 24-hour trading volume for DOT/USD is currently at $180,503,152 and the market capitalization is trading at $5,299,102,760.
Polkadot price analysis 1-day chart
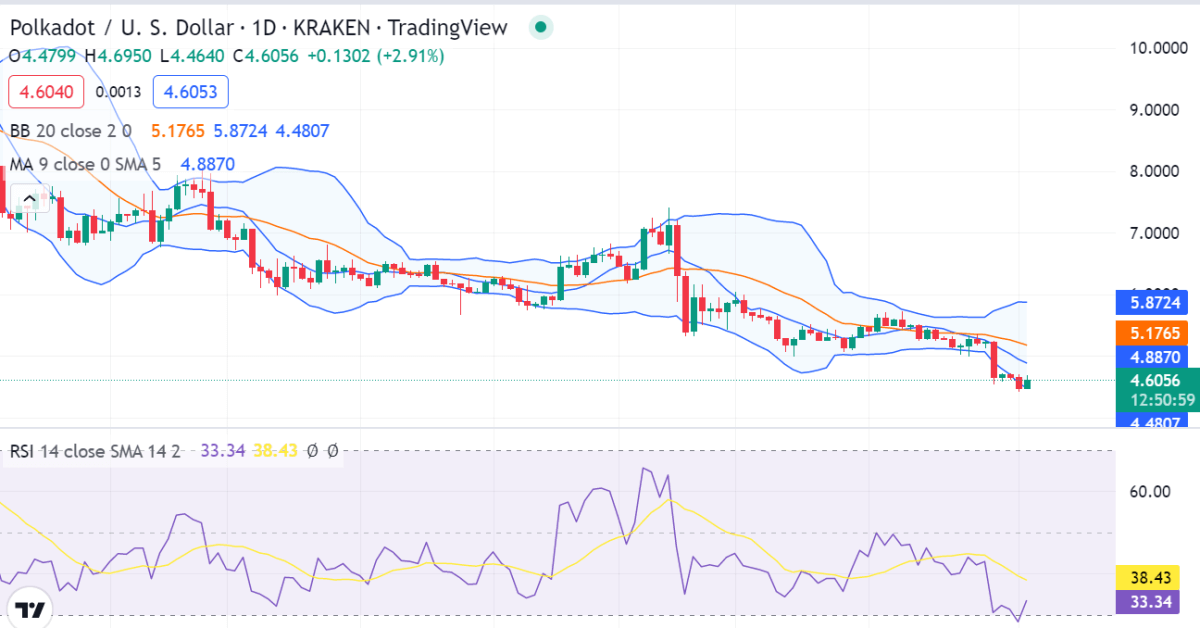
The 1-day Polkadot price analysis reveals that the DOT/USD pair hit highs of $4.65 and lows of $4.44, and is currently trading at $4.61. As of today, the market was in a decline and lost about 0.91 percent of its value. Due to the persistently negative market attitude, the DOT/USD pair is currently in a bearish trend. The fact that the digital asset is currently trading below the moving averages suggests that the short-term bearish trend will probably persist. The price has fallen below the moving average (MA) level, or $4.887, as a result of the most recent loss.

The relative strength index (RSI) graph is also showing downward movement, as the score has decreased considerably today and has reached an index of 38.43 which is below the 50 level. The rising Bollinger band indicates that further downtrends are occurring as volatility rises. For the DOT/USD pair, the lower band of the Bollinger Bands indicator is present at a $4.4807 margin, while the upper band is hitting the $5.8724 mark.
DOT/USD on 4-hour price analysis: Latest development
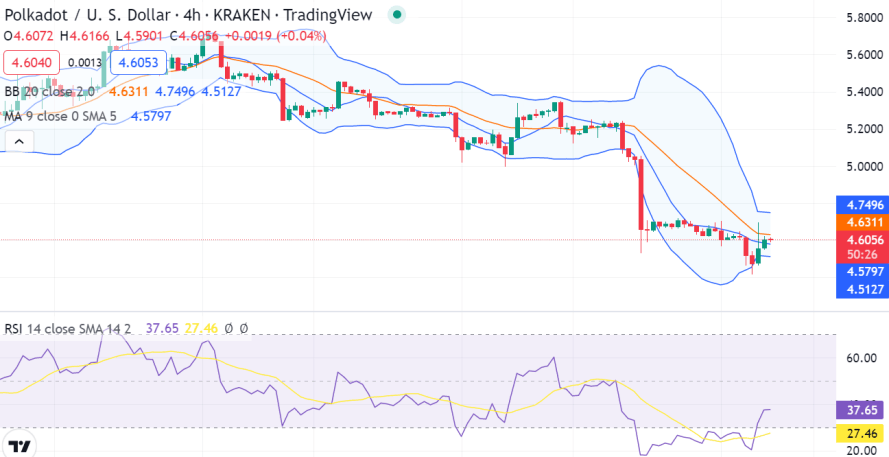
The 4-hour Polkadot price analysis reveals that the price levels are steadily declining and that the pricing function is once again headed downward. The price levels are being dragged down by the bears, and as of this writing, they are at a level of $4.62.Polkadot shows that the market volatility follows an ambiguous closing movement, which makes DOT prices less vulnerable to volatile shifts. The strongest resistance level for DOT is therefore $4.7496, which corresponds to the upper limit of Bollinger’s band. Bollinger’s band’s lower boundary, which represents the strongest support for DOT, is at $4.5127.

The 50-MA crosses below the 200-MA, indicating a bearish cross on the moving average indicator. With the MA around $4.5797, there is a tiny bias toward the downside in the immediate term. The 4-hour relative strength index (RSI) is currently at 27.46 which indicates that the bears are in control of the market.
Polkadot price analysis conclusion
The Polkadot price analysis is indicating that today has also seen bearish behavior. The last four hours have seen a decrease in price, reaching $4.60. DOT is still looking for financial assistance, which is available at the $4.59 level. If the selling pressure persists, DOT/USD may experience greater drops in the near term because the general market trend is also adverse


