Polkadot price analysis shows the coin has been trading below the $4.53 mark for most of the hours today, with a low of $4.45. The current support levels for DOT/USD are at $4.45, and if the price breaks below this level then it could see further losses. On the other hand, there is resistance at $4.53, so if the price breaks above this level then it could see further gains.
The DOT opened the day at $4.46 and has been trending downwards ever since, with the buying pressure not being strong enough to push the price up. The bullish pressure that was seen the previous day has faded away and the bears have taken control of the market.
Polkadot price analysis 1-day price chart: BCH to revisit $6354 support
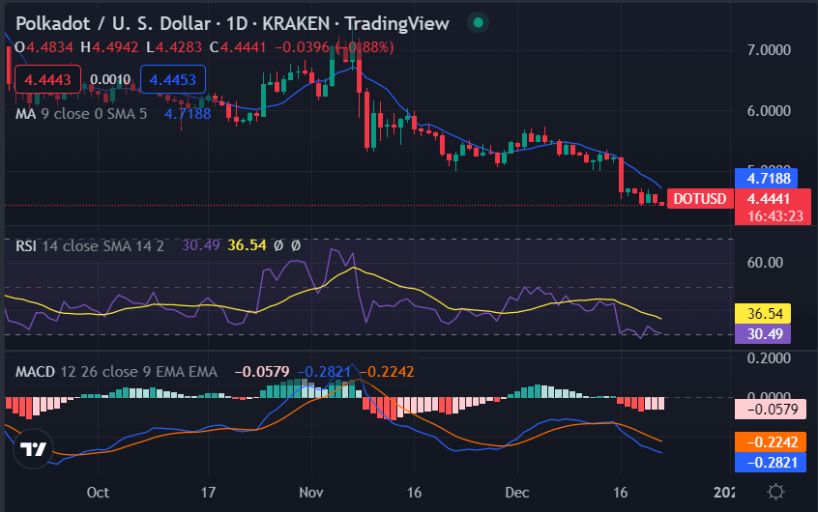
The 1-day price chart for Polkadot price analysis shows the coin has been showing a bearish tendency since 21st December, but the bearish pressure further ignited today as the price has come down a lot and is currently trading at around $4.45. DOT/USD reports a loss of 1.54 percent over the last 24 hours and reports a loss in value amounting to 14.11 percent over the previous week. On the contrary, the trading volume for DOT/USD is currently at $115 million and is currently ranked at the 12th position in terms of market capitalization with a total market cap of $5.11 billion.

The 50-day moving average is currently around the $4.87 level and the 20-day moving average is at $4.62, so this could serve as a resistance level for DOT/USD. The Moving average convergence divergence (MACD) for DOT/USD is currently in the bearish region and the Relative Strength Indicator (RSI) is around 36.54. This indicates that the bears still have control of the market and could push the price down further.
Polkadot price analysis: Recent developments and further technical indications
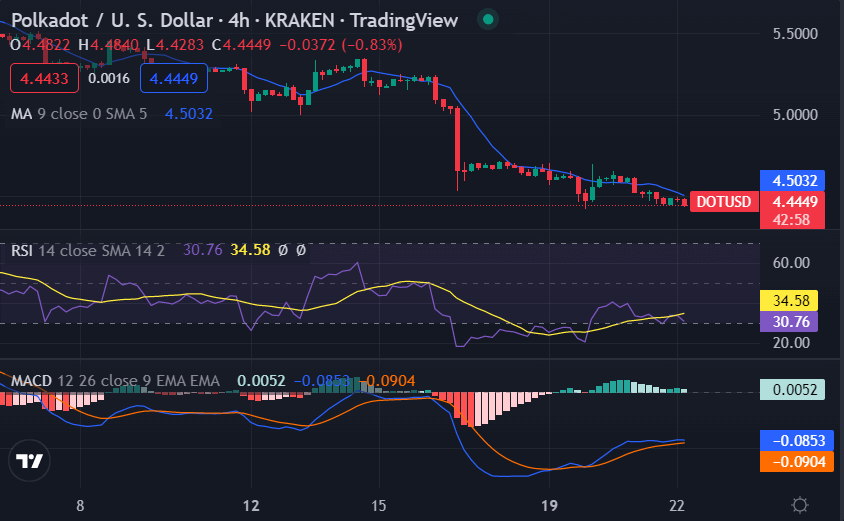
The 4-hour price chart for Polkadot price analysis shows the coin got support at $4.45, as the price took an upturn from this point rejecting further downside. The price has been elevated up to $4.45. The increase is comparatively very small, but the last green candlestick is hopeful assuming the price is maintaining its level now.

The MACD for DOT/USD is still in the bearish region as the signal line is below the MACD line. The RSI for DOT/USD is currently at 34.58, indicating that the bearish pressure is still intact and could push the price further down. The moving average (MA) has also started to travel downwards and s trading at the $4.50 level.
Polkadot price analysis conclusion
The Polkadot price analysis shows the price is present at the lowest level of the year. But as we know, the entire market has been trembled down today, and DOT also followed the trend. The hopeful sign is the present support that just appeared, but we assume the persistence of the support will define DOT’s next move.


