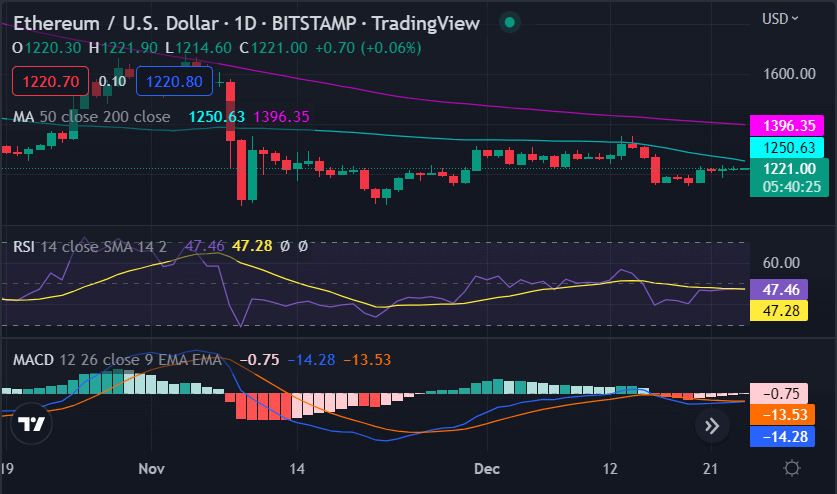
Ethereum price analysis shows sideways price movement for the day as the price is recovering slowly. However bearish and the bulls are struggling to take control of the market as the sell-off continues. But currently, ETH/USD is trading above $1,219 this is because the bulls have managed to escape through the bearish pressure, and green candlesticks have returned to the price charts. More buyers are entering the market and taking the price flow in the upwards direction. The price had been moving upward quite consistently since yesterday, and now it has reached the $1,221 resistance level as the bulls are powering through.
ETH/USD 1-day price chart: Bulls Emerges as Ethereum hits $1,219
The 1-day Ethereum price analysis shows that the market has been in a strong bearish since early today as it dipped to $1,216, However, the bulls have managed to push the price back up and ETH/USD is now trading above $1,219. The buyers are still in control of the market, though the bears are trying to capitalize on any weakness. If Ethereum price analysis shows that buyer sentiment remains strong, then ETH/USD could move further upwards toward the $1,221 resistance level.

The 50 -day moving average is currently flat, and the 200-day moving average is still rising, which indicates that the long-term trend is still bullish. The RSI is currently below 50, which indicates that the market has some room to move higher before becoming overbought. The MACD line is currently above the signal line, which indicates that the market is in a strong uptrend.
Ethereum price analysis on a 4-hour price Chart: ETH/USD trades above $1,216
On the 4-hour chart, Ethereum price analysis, we can see that the market has formed an ascending parallel channel and is currently trading at the upper boundary of the channel. Prices have recently broken out of a descending triangle pattern which is a bullish sign. Currently, ETH/USD is up by 0.05% which is a small gain but still positive.

The RSI on 4-hour is currently at 53.12, which is in the overbought region and indicates that the market might be due for a correction. The MACD line indicator is currently above the signal line, indicating that the market is in a strong uptrend but is losing momentum. The 50-Moving average and 200-moving averages are both still rising, which indicates that the long-term trend is still bullish. The 50 MA is currently at $1,200, while the 200 MA is at $1,230.
Ethereum price analysis conclusion
The price levels have increased further today, as has been confirmed by the fours Ethereum price analysis. The bullish candlesticks have reappeared on the price chart as the trends underwent a reversal. The price has increased to the $1,219 level after the bullish comeback. But, if the buyers’ support remains intact, there is a chance that the uptrend for Ethereum may continue.


