Dogecoin price analysis reveals that as bears seize control of the market, DOGE market sentiment has dropped by around 2.06 percent and is trading below the $0.07414 level. The bears are trying hard to drag the Dogecoin price into their zone. Support for the DOGE/USD pair is at $0.07398, while resistance is situated around $0.07602. The current CoinMarketCap ranking is #8, with a live market cap of $9,839,204,915, and the 24-hour trading volume has decreased by 9.46% and is currently at $287,336,873.
Dogecoin price analysis on 1-day chart
The 1-day Dogecoin price analysis reveals that the price broke down to the downside today and is still breaking down as of now, with the DOGE/USD pair trading at $0.071414 as of this writing. From yesterday’s trend, the price was going down, and now it appears to be going sideways. The Bollinger bands have somewhat diverged, and DOGE’s volatility has marginally increased. The upper limit, which stands for resistance to the coin’s price action, is currently at $0.0999, while the lower limit, which supports the pair of cryptocurrencies, is at $0.0651.

The relative strength index (RSI) is currently at 38.04, which indicates that the bears are still in control of the market. The RSI’s downward slope indicates the selling pressure and activity that are now present in the market. The moving average convergence and divergence (MACD) line is below the signal line, which shows that the current trend is bearish. In addition, the indicator has significant negative momentum as seen in the high histogram level
DOGE/USD on 4-hour price chart: Latest development
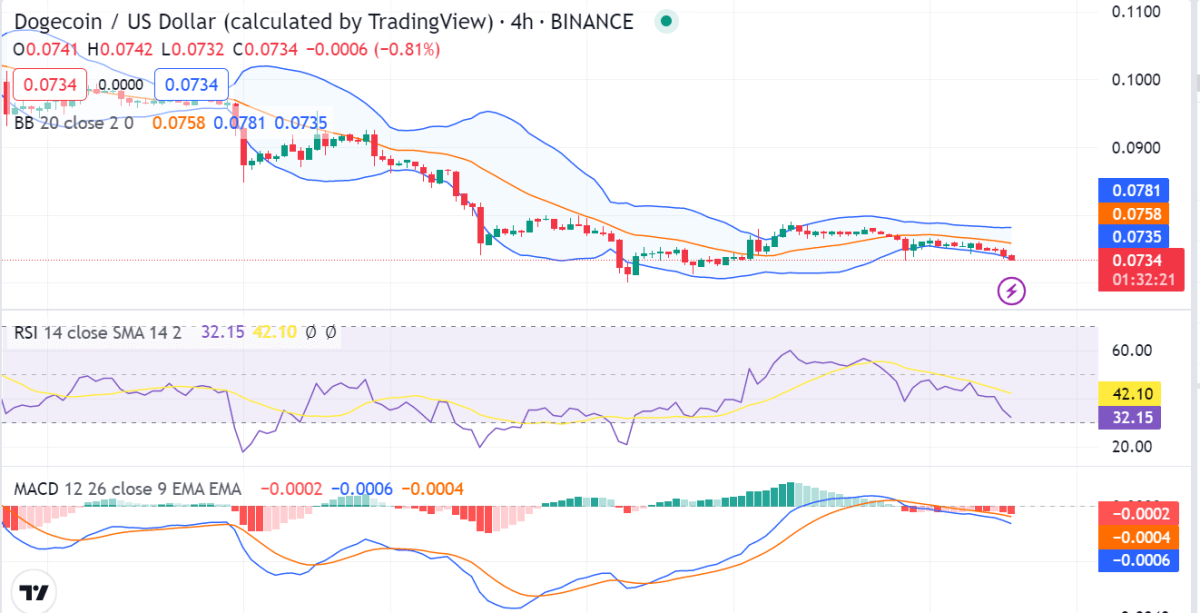
The 4-hour Dogecoin price analysis reveals that the DOGE’s price has dropped slightly to around $0.07414, down 2.06% in the last 24 hours. If DOGE is able to surpass and hold above the $0.07550 resistance level, we may see it continue to rise toward $0.80. However, if it is unable to surpass this resistance level, a slight retracement may be witnessed in the next hours.

The Bollinger Band indicator’s bands are slowly decreasing, which indicates that volatility is steadily decreasing. The lower band is at $0.0735, and the upper band is at $0.0781. The market is under selling pressure, as indicated by the RSI index’s downward slope and position at 42.10. The signal line (red) is above the MACD line (blue), which suggests that downward momentum could continue in the near future.
Dogecoin price analysis conclusion
According to the Dogecoin price analysis, the market is presently in a bearish phase, and if the bears continue to control the market, a negative breakout may occur. $0.07398 and $0.07602 are the main levels of support and resistance, respectively. A break over the $0.07414 mark might signal an uptrend toward the $0.075 level, and a negative closing below the $0.0741 level could signal a decline toward the $0.073 level.


